Evaluation
EURO-CORDEX 0.44°
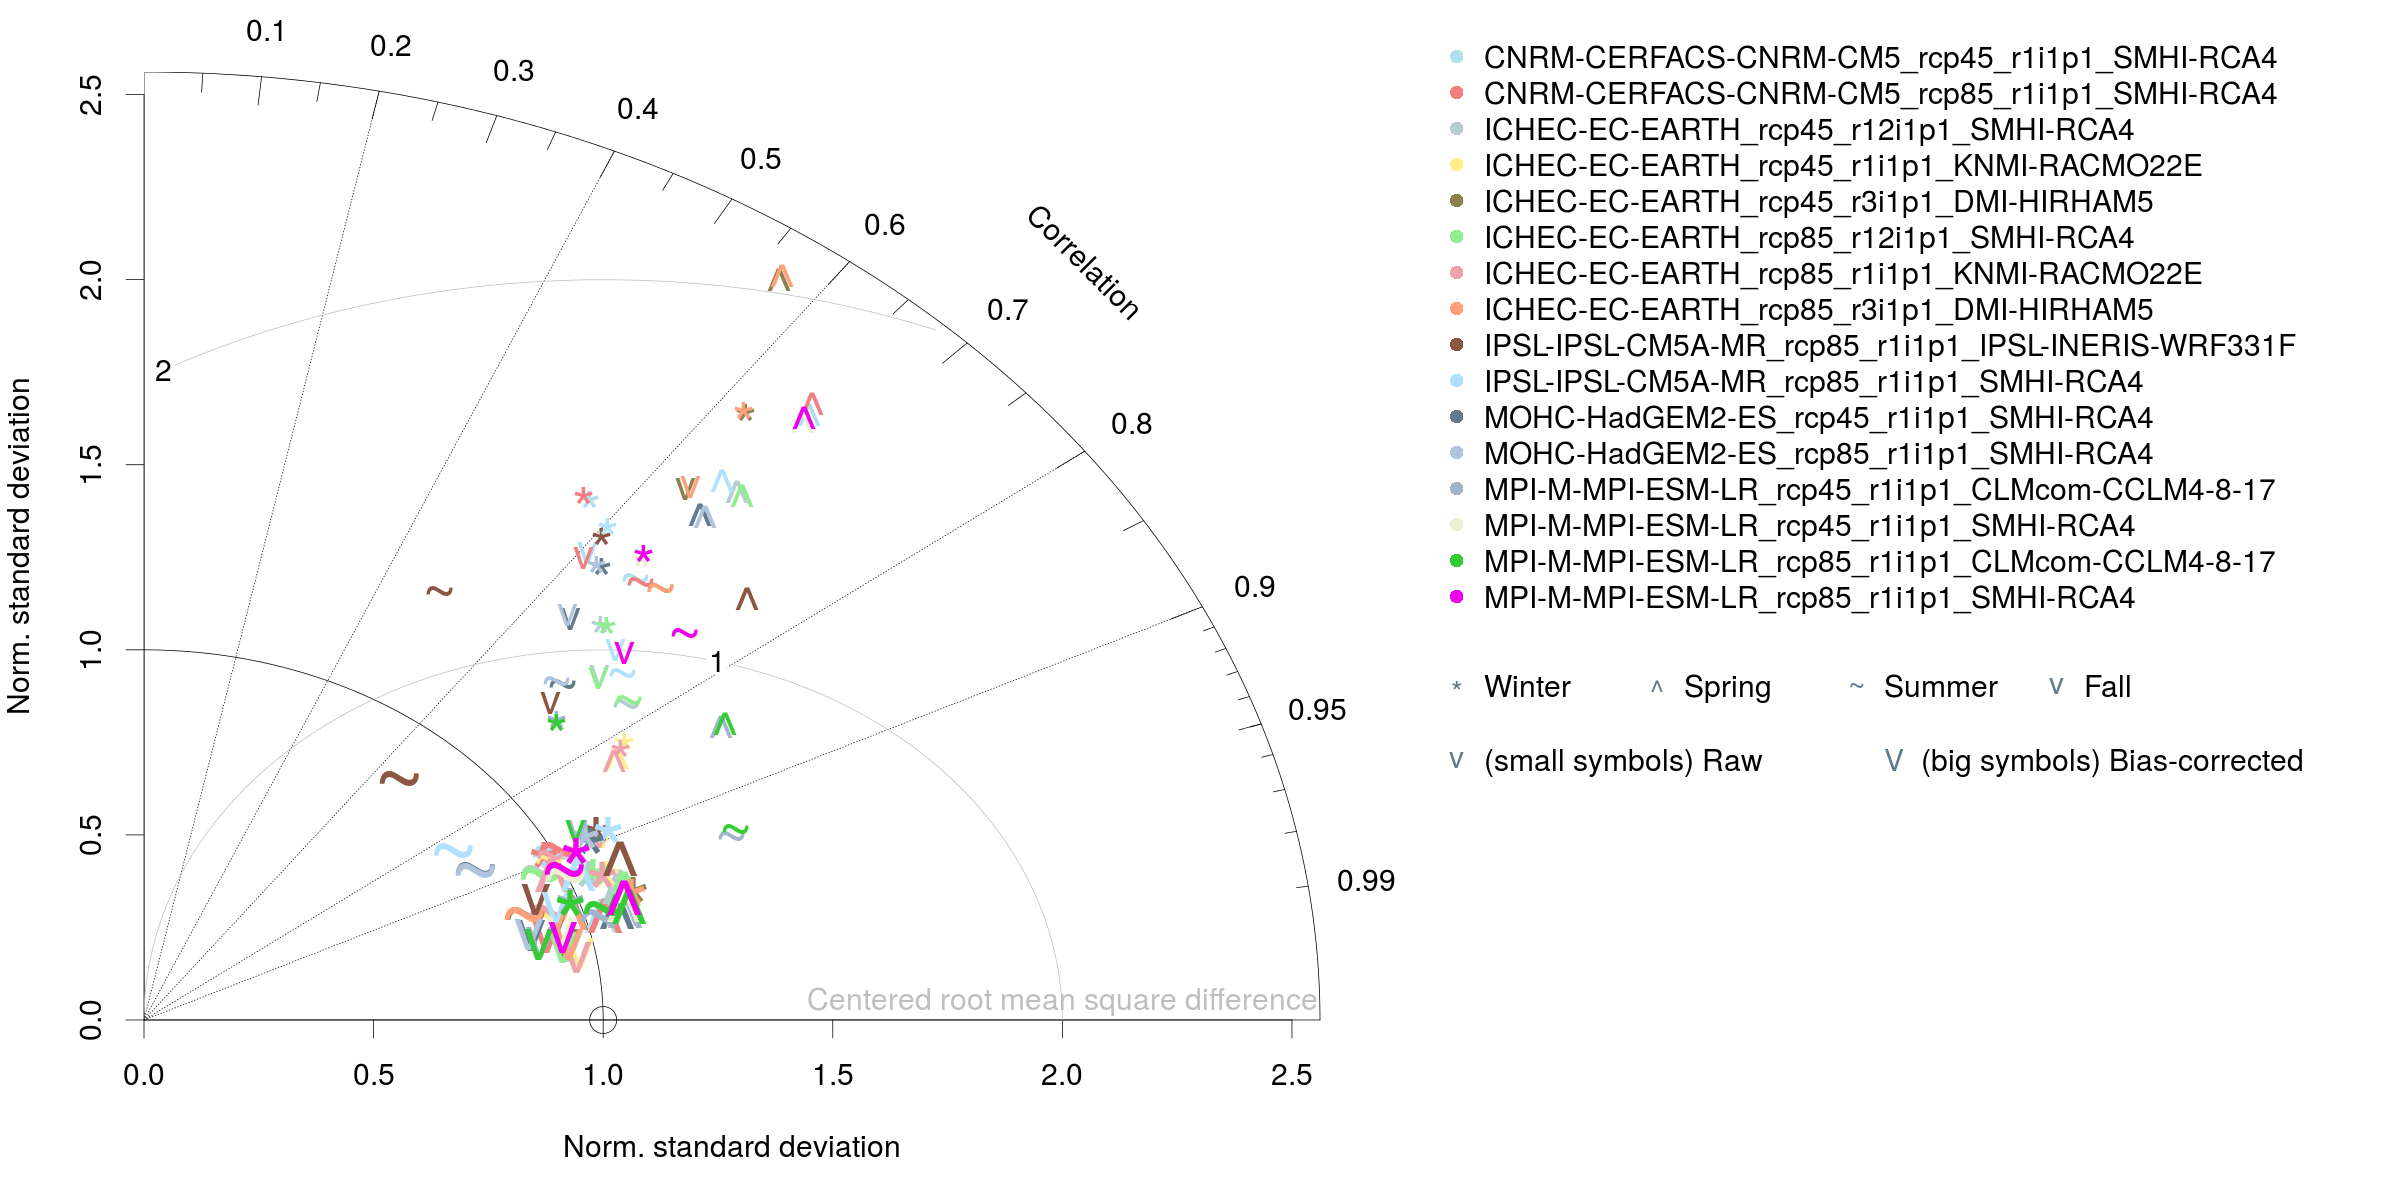
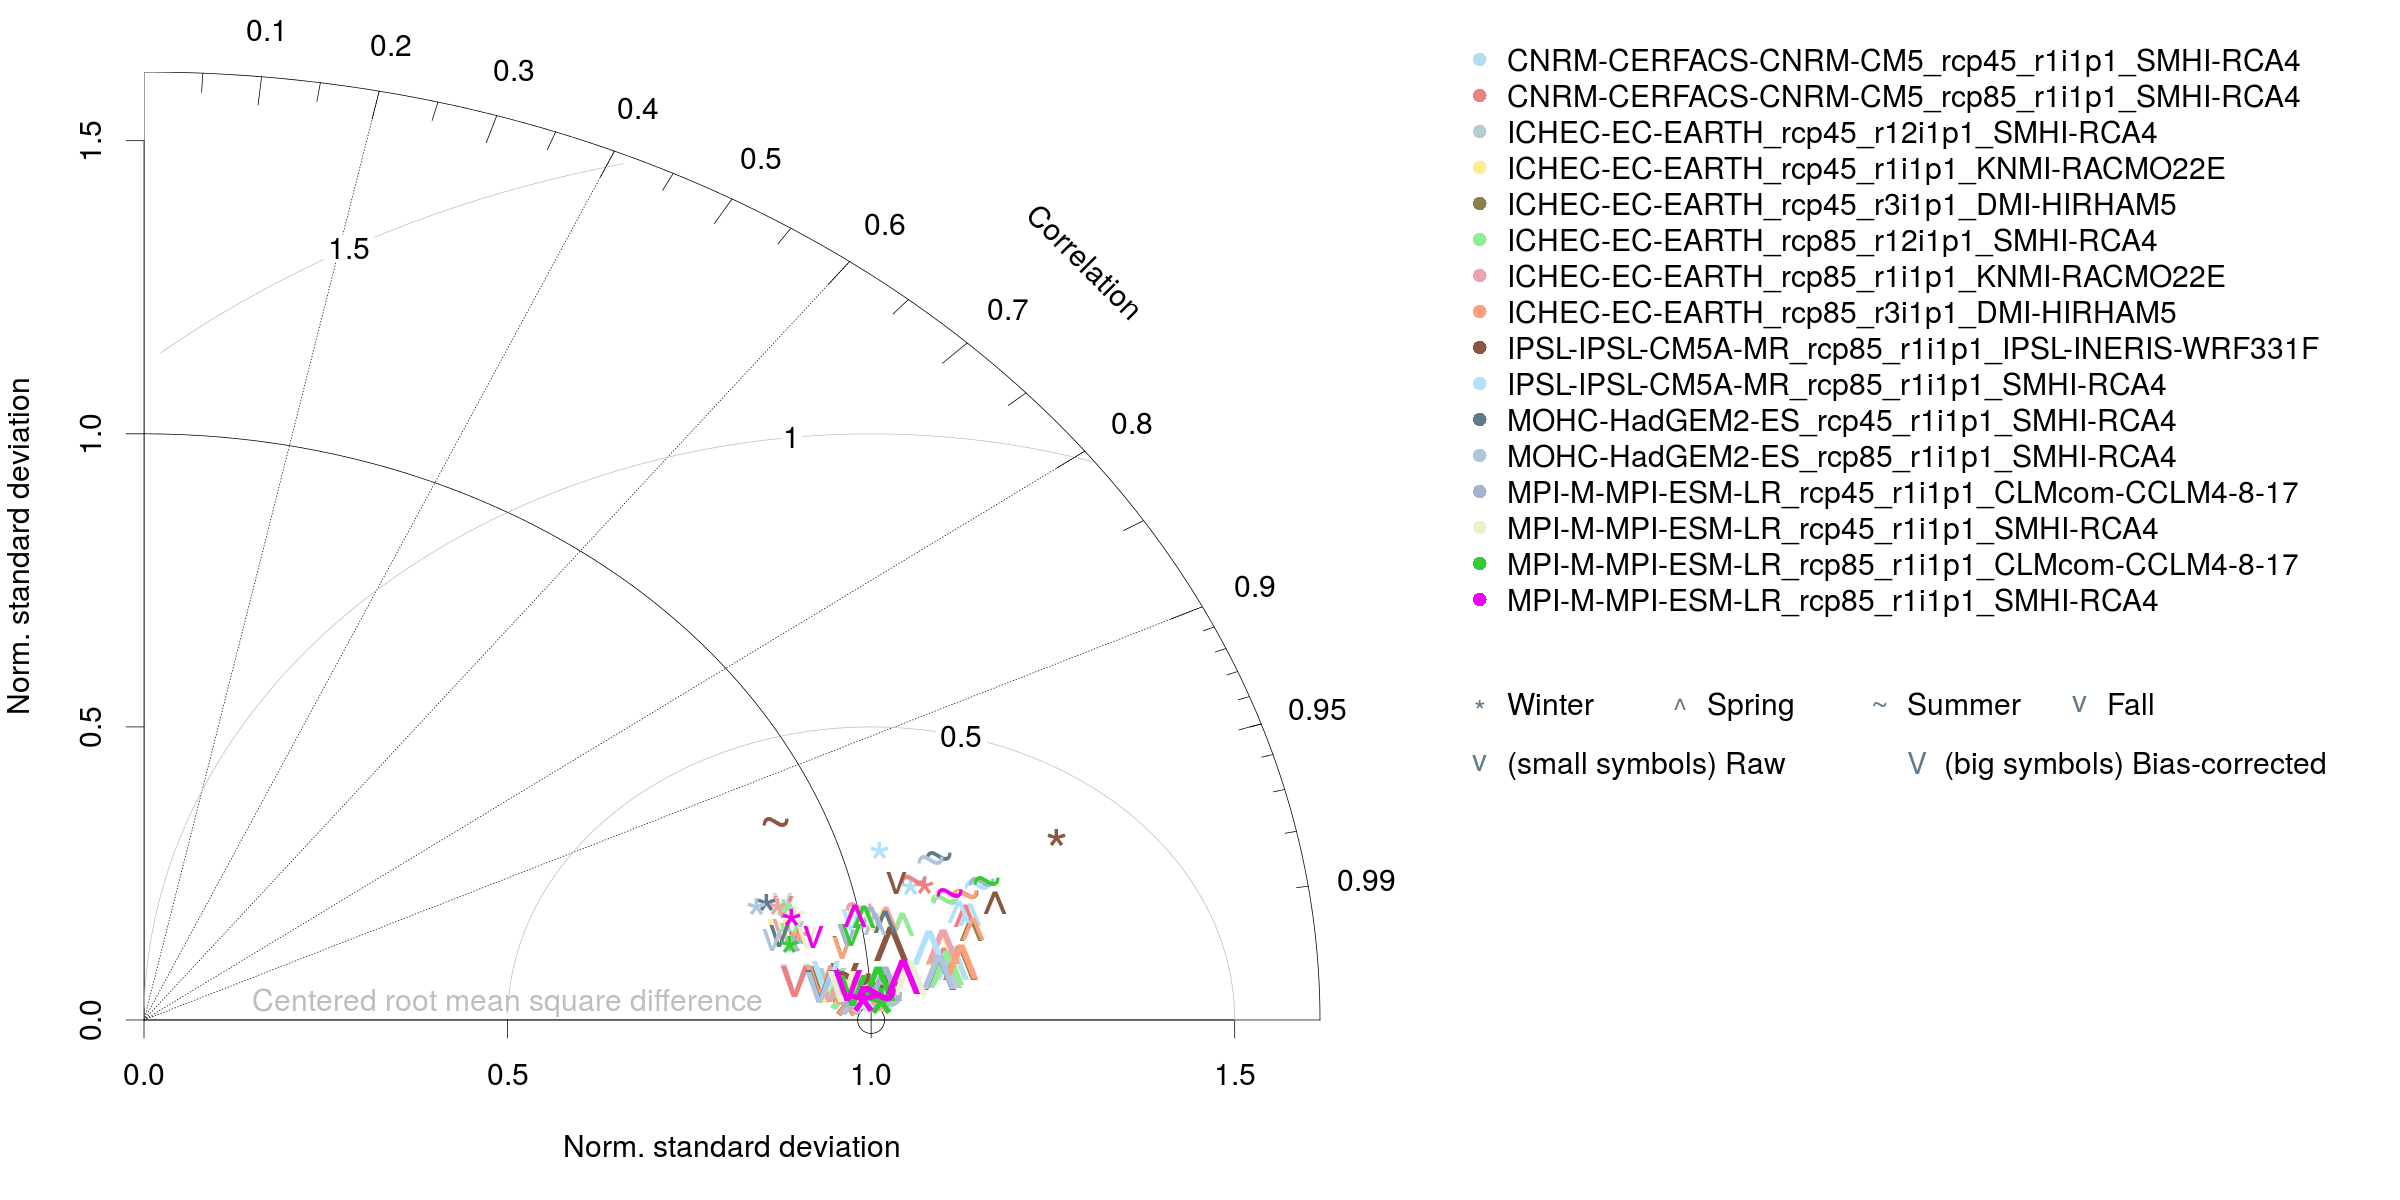
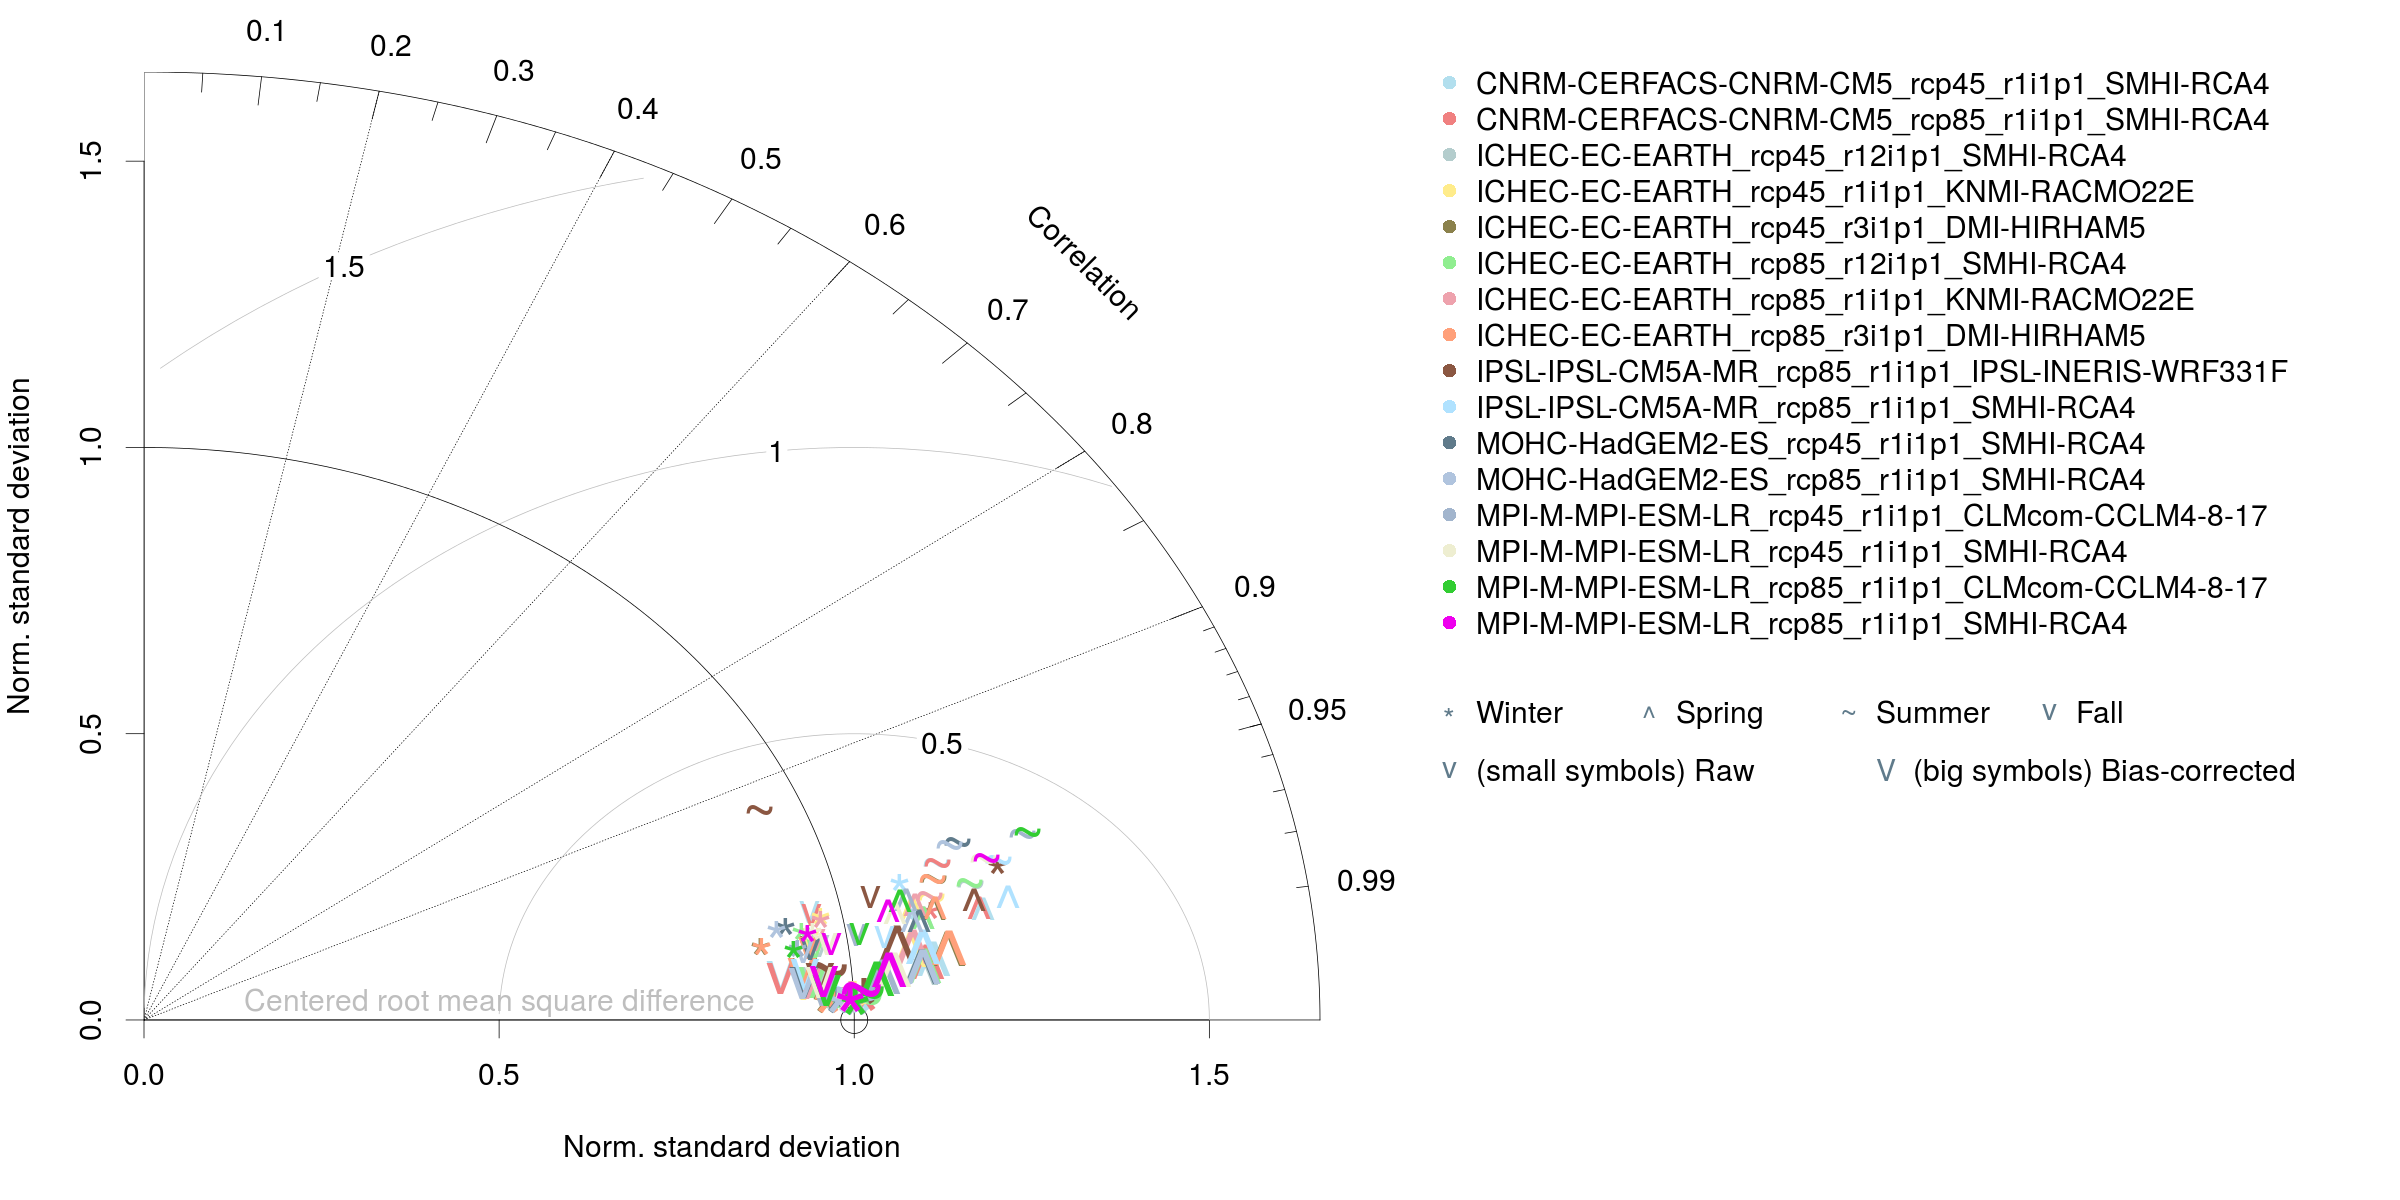
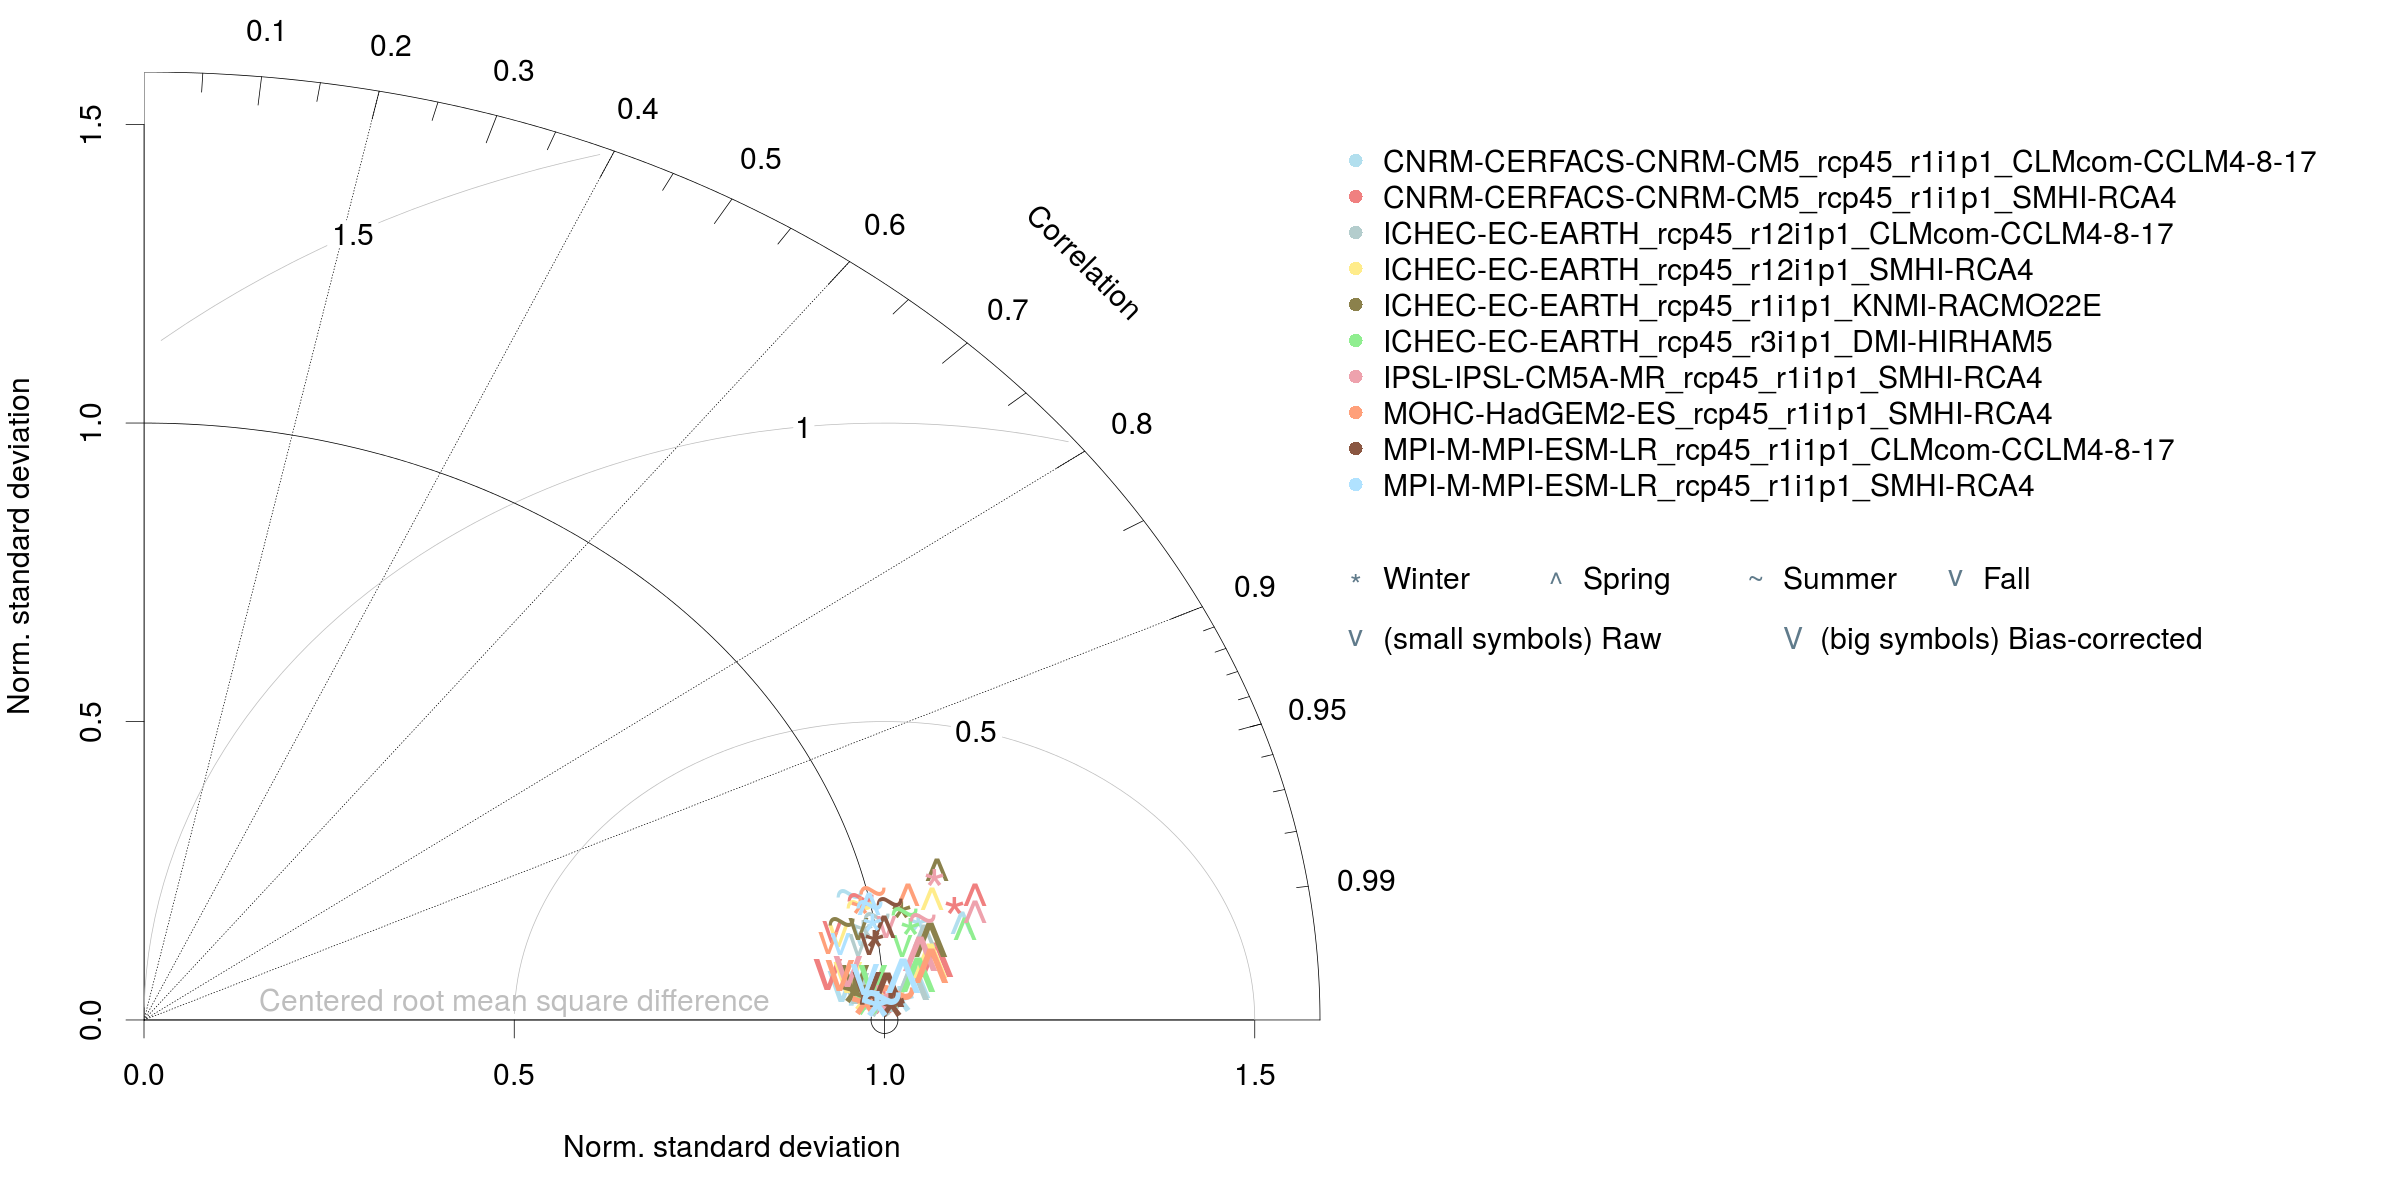
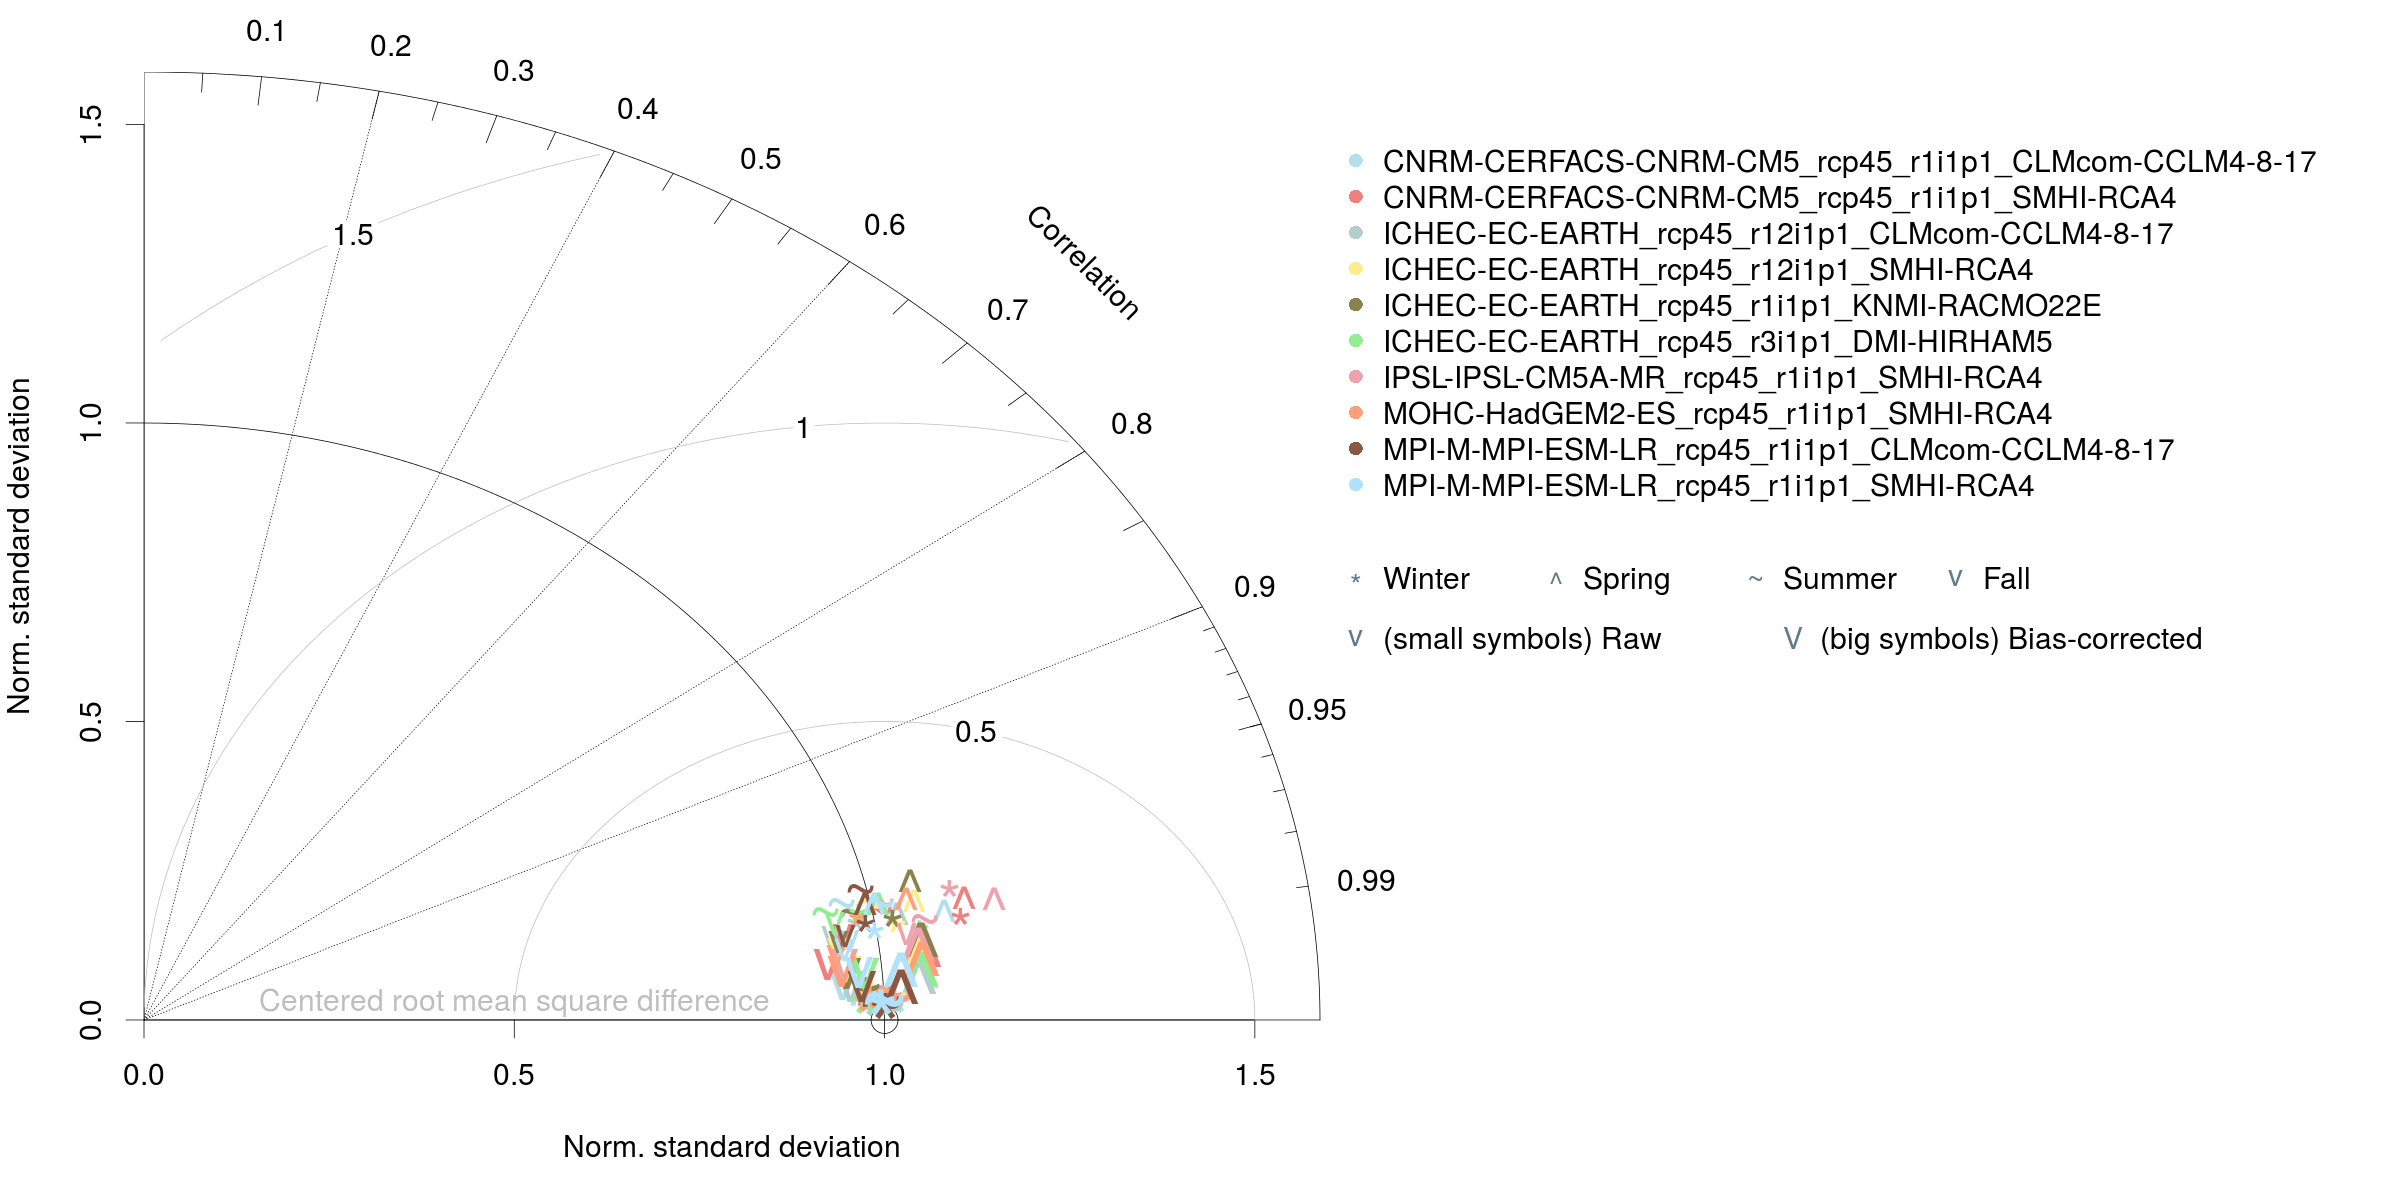
The following plots show Taylor diagrams for the bias-corrected and the raw RCM simulations at the EURO-CORDEX 0.44° grid (click for hi-res images). The daily 0.44° EOBS10 data are used as reference. Correlations and standard deviations are calculated from spatial values, i.e., the long-term means (1981-2010).
The RCM runs shown are given in the legend. Each plot shows the bias-corrected (large symbols) and the raw data (smaller symbols) for one variable (in the order pr, tas, tasmax and tasmin) and for the four seasons winter (DJF), spring (MAM), summer (JJA) and fall (SON).

Overall and seasonal biases of the raw and bias-corrected for the individual RCM runs are shown here:
bias_pr_eur-44.pdf
bias_tas_eur-44.pdf
bias_tasmax_eur-44.pdf
bias_tasmin_eur-44.pdf
EURO-CORDEX 0.11°
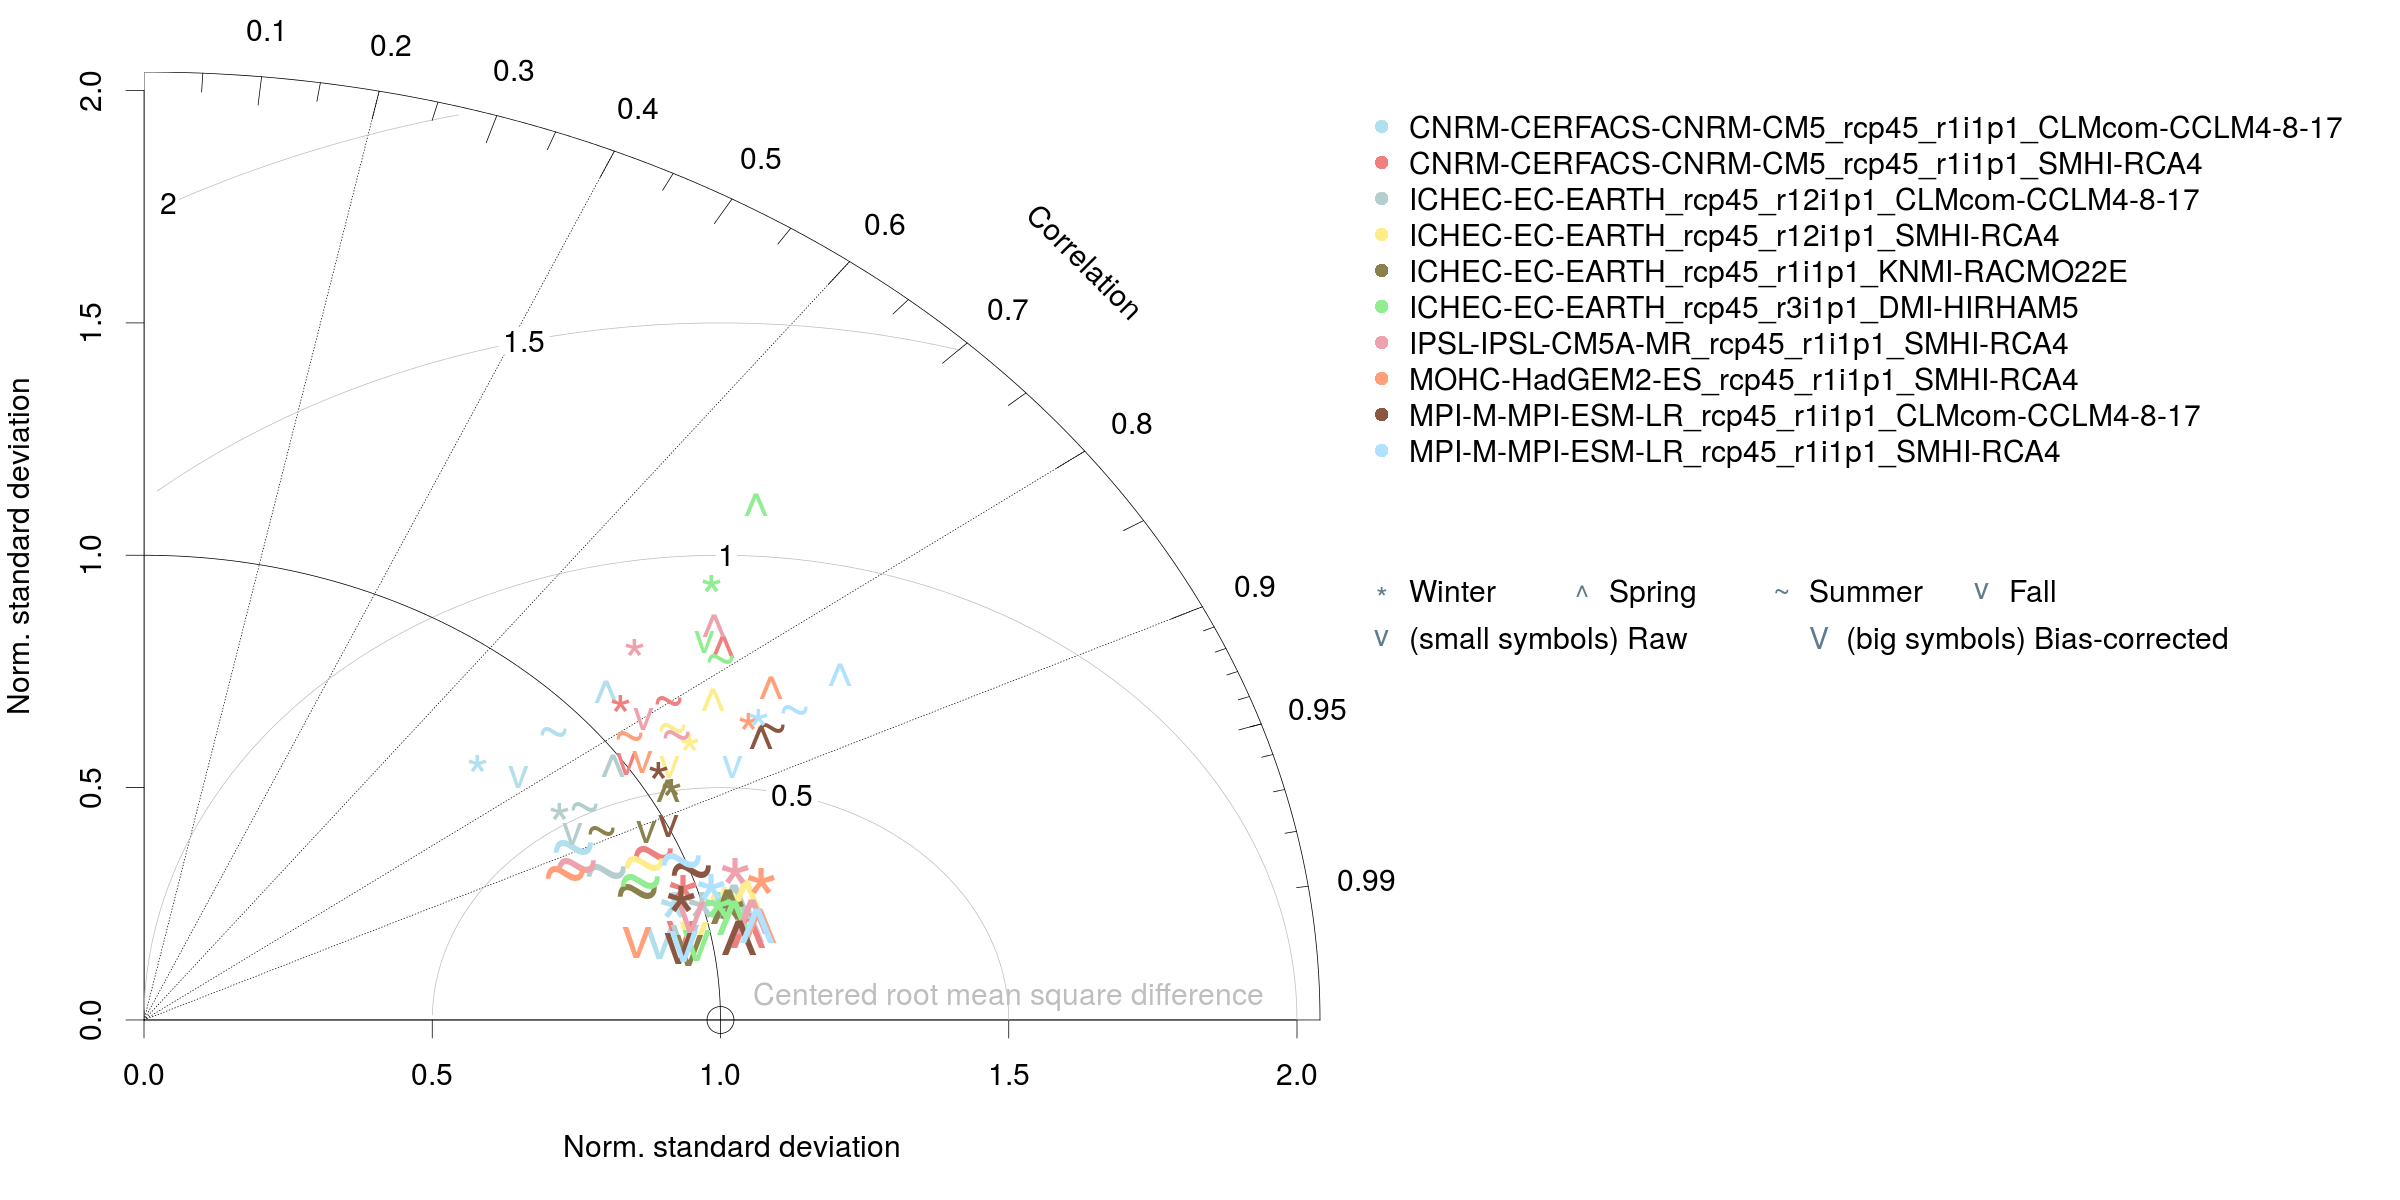
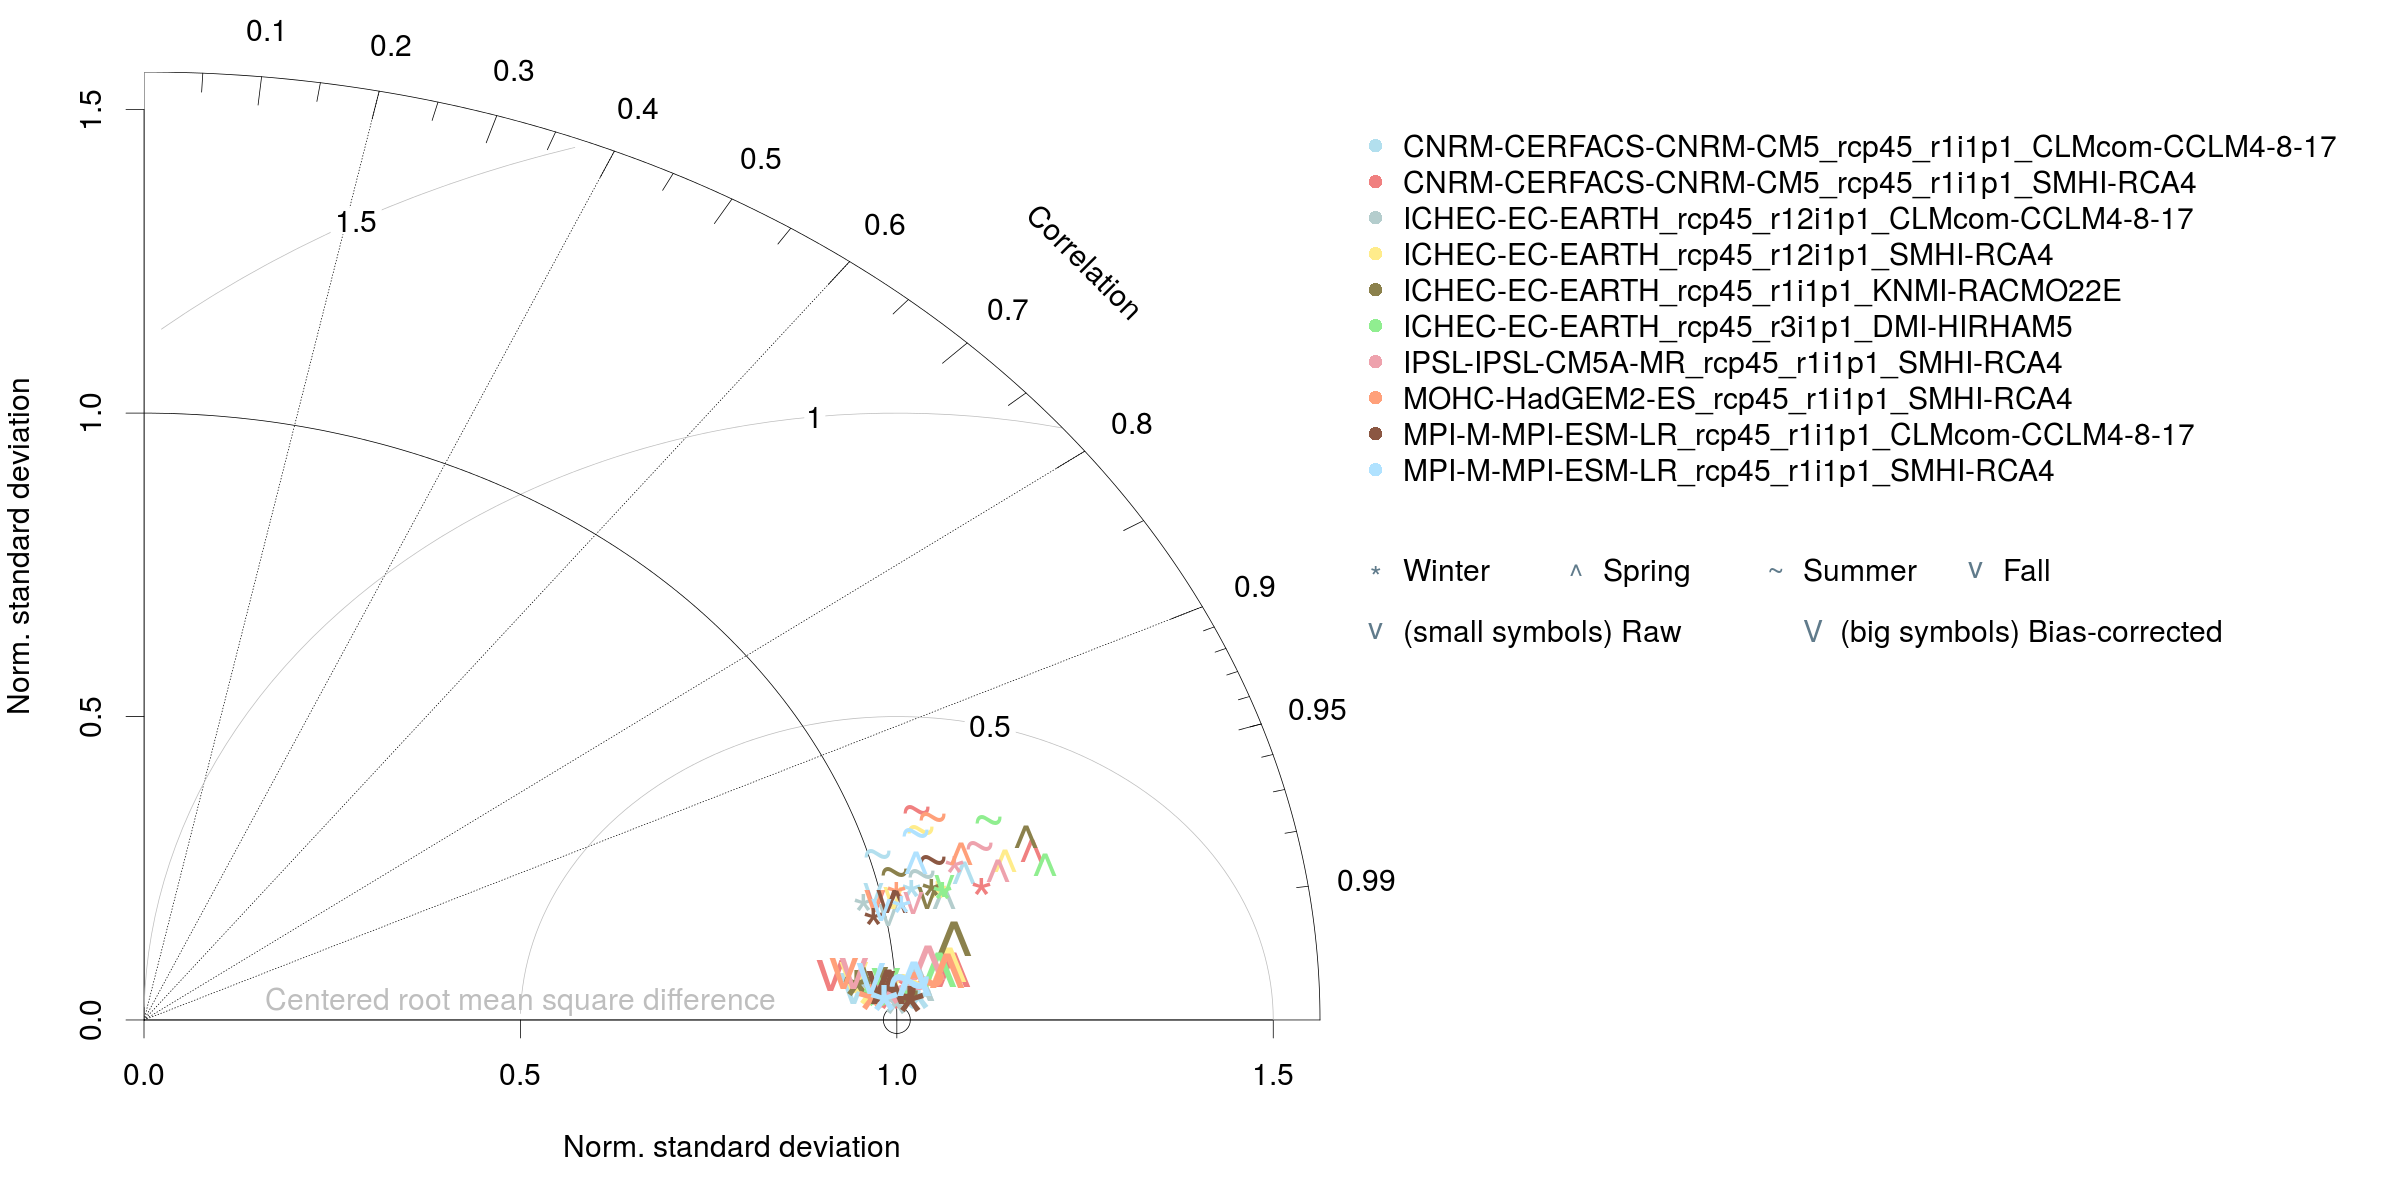
The following plots show Taylor diagrams for the bias-corrected and the raw RCM simulations at the EURO-CORDEX 0.11° grid (click for hi-res images). The daily 0.11° MESAN data are used as reference. Correlations and standard deviations are calculated from spatial values, i.e., the long-term means (1989-2010).
The RCM runs shown are given in the legend. Each plot shows the bias-corrected (large symbols) and the raw data (smaller symbols) for one variable (in the order pr, tas, tasmax and tasmin) and for the four seasons winter (DJF), spring (MAM), summer (JJA) and fall (SON).
Overall and seasonal biases of the raw and bias-corrected for the individual RCM runs are shown here:
bias_pr_eur-11.pdf
bias_tas_eur-11.pdf
bias_tasmax_eur-11.pdf
bias_tasmin_eur-11.pdf
Summary
As expected, the bias-correction method reduces (but does not remove) the seasonal biases and removes the overall biases almost completely for all variables. The remaining annual biases are due to the use of “only” 101 quantiles to estimate the empirical cumulative distribution functions within qmap. The additionally remaining seasonal biases are due to the calibration process which is carried out without splitting into seasons or months.
Impact on climate change signal
Within the CHASE-PL project, the same bias-correction method was used but with a different observational data set (for Poland only) and splitting into seasons for calibration.
Here you can see the impact of the method on the mean climate change signal of precipitation for the far (2071-2100) and near (2051-2070) future over Poland for the single models and the ensemble mean.
Andreas Dobler 2016/04/28 15:00