Akima Tests
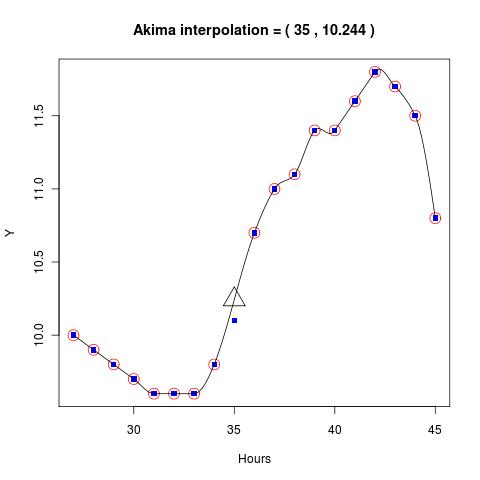
The following graphs illustrate comparisons between an Akima Interpolation and Linear Interpolation for single missing points. The title gives the time of the missing value, which is located at Hours=3 on each graph. The linear interpolation is the square on the straight line segment. The real data are displayed as blue squares. The curve is the Akima Spline and the corrected value that would be provided by the Akima Interpolation is indicated by the triangle.


StationID = 59800; Start Time=20080706-06
Investigation with some longer time intervals.
- Point selected at Hour=33, Actual Original Value = 15.9 degrees Celsius.
- Neighbours: (32,15.2) (36,17.1) ⇒ Linear Interpolation = 16.2 (16.15)
- The point is treated as a missing point for the following Akima interpolations.
Key:
| Blue Squares: | Original data |
|---|---|
| Red circles: | Points used in the interpolation |
| Triangle: | The Akima Point |
| Curve: | The Akima Fit |


StationID = 18700; Start Time=20080706-06; Example 1
- Actual original = 10.1 Degrees Celsius
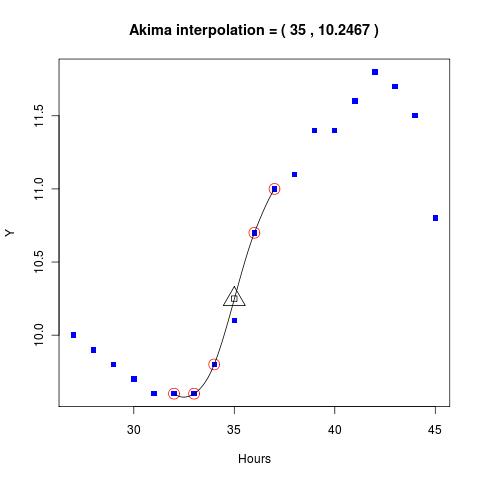
- Square below is the linear interpolation:


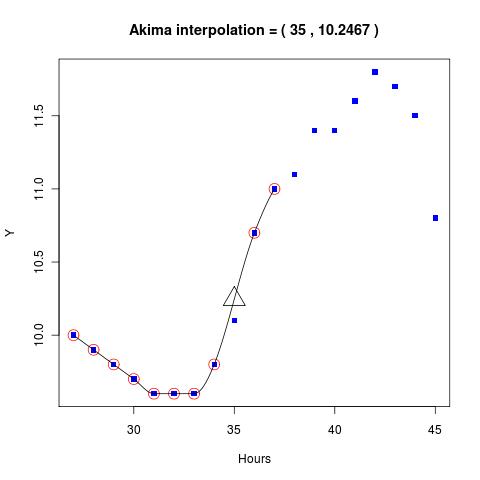
StationID = 18700; Start Time=20080706-06; Example 2


Using Akima in the DipTest Algorithm
stationid |       obstime       | original | paramid |       tbtime        | typeid | sensor | level | corrected |   controlinfo    |     useinfo      |              cfailed
-----------+---------------------+----------+---------+---------------------+--------+--------+-------+-----------+------------------+------------------+------------------------------------
     99990 | 2027-07-08 12:00:00 |    -30.8 |     211 | 2007-07-08 12:03:18 |      1 | 0      |     0 |     -30.8 | 1111000000100010 | 7000000000000000 |
     99990 | 2027-07-08 13:00:00 |    -28.1 |     211 | 2007-07-08 13:03:26 |      1 | 0      |     0 |     -28.1 | 1111000000100010 | 7000000000000000 |
     99990 | 2027-07-08 14:00:00 |    -27.8 |     211 | 2007-07-08 14:03:27 |      1 | 0      |     0 |     -27.8 | 1111000000100010 | 7000000000000000 |
     99990 | 2027-07-08 15:00:00 |      -32 |     211 | 2007-07-08 15:03:35 |      1 | 0      |     0 |       -32 | 1111000000100010 | 7000000000000000 |
     99990 | 2027-07-08 16:00:00 |    -31.8 |     211 | 2007-07-08 16:03:39 |      1 | 0      |     0 |     -31.8 | 1111000000100010 | 7000000000000000 |
     99990 | 2027-07-08 17:00:00 |    -24.1 |     211 | 2007-07-08 17:03:20 |      1 | 0      |     0 |       -31 | 1119000000100010 | 5033300000000001 | QC1-3a-211:1,QC2d-1-A,Linear=-30.8
     99990 | 2027-07-08 18:00:00 |    -29.8 |     211 | 2007-07-08 18:03:25 |      1 | 0      |     0 |     -29.8 | 1114000000100010 | 5010300000000001 | QC2d-1
     99990 | 2027-07-08 19:00:00 |    -26.8 |     211 | 2007-07-08 19:03:31 |      1 | 0      |     0 |     -26.8 | 1111000000100010 | 7000000000000000 |
     99990 | 2027-07-08 20:00:00 |    -25.6 |     211 | 2007-07-08 20:03:12 |      1 | 0      |     0 |     -25.6 | 1111000000100010 | 7000000000000000 |
     99990 | 2027-07-08 21:00:00 |    -26.8 |     211 | 2007-07-08 21:03:18 |      1 | 0      |     0 |     -26.8 | 1111000000100010 | 7000000000000000 |
     99990 | 2027-07-08 22:00:00 |    -26.6 |     211 | 2007-07-08 22:02:43 |      1 | 0      |     0 |     -26.6 | 1111000000100010 | 7000000000000000 |
     99990 | 2027-07-08 23:00:00 |    -25.5 |     211 | 2007-07-08 23:03:28 |      1 | 0      |     0 |     -25.5 | 1111000000100010 | 7000000000000000 |


     99990 | 2027-07-09 17:00:00 |    -31.3 |     211 | 2007-07-09 17:02:50 |      1 | 0      |     0 |     -31.3 | 1111000000100010 | 7000000000000000 |
     99990 | 2027-07-09 18:00:00 |    -29.3 |     211 | 2007-07-09 18:02:55 |      1 | 0      |     0 |     -29.3 | 1111000000100010 | 7000000000000000 |
     99990 | 2027-07-09 19:00:00 |    -30.6 |     211 | 2007-07-09 19:03:01 |      1 | 0      |     0 |     -30.6 | 1111000000100010 | 7000000000000000 |
     99990 | 2027-07-09 20:00:00 |    -28.8 |     211 | 2007-07-09 20:03:20 |      1 | 0      |     0 |     -28.8 | 1111000000100010 | 7000000000000000 |
     99990 | 2027-07-09 21:00:00 |    -25.1 |     211 | 2007-07-09 21:02:25 |      1 | 0      |     0 |     -25.1 | 1111000000100010 | 7000000000000000 |
     99990 | 2027-07-09 22:00:00 |    -32.7 |     211 | 2007-07-09 22:03:39 |      1 | 0      |     0 |       -28 | 1119000000100010 | 5033300000000001 | QC1-3a-211:1,QC2d-1-A,Linear=-28.5
     99990 | 2027-07-09 23:00:00 |      -32 |     211 | 2007-07-09 23:04:18 |      1 | 0      |     0 |       -32 | 1114000000100010 | 5010300000000001 | QC2d-1
     99990 | 2027-07-10 00:00:00 |      -32 |     211 | 2007-07-10 00:03:19 |      1 | 0      |     0 |       -32 | 1111000000100010 | 7000000000000000 |
     99990 | 2027-07-10 01:00:00 |    -34.7 |     211 | 2007-07-10 01:03:28 |      1 | 0      |     0 |     -34.7 | 1111000000100010 | 7000000000000000 |
     99990 | 2027-07-10 02:00:00 |    -34.7 |     211 | 2007-07-10 02:03:53 |      1 | 0      |     0 |     -34.7 | 1111000000100010 | 7000000000000000 |
     99990 | 2027-07-10 03:00:00 |    -31.3 |     211 | 2007-07-10 03:03:55 |      1 | 0      |     0 |     -31.3 | 1111000000100010 | 7000000000000000 |
     99990 | 2027-07-10 04:00:00 |    -30.3 |     211 | 2007-07-10 04:04:01 |      1 | 0      |     0 |     -30.3 | 1111000000100010 | 7000000000000000 |
     99990 | 2027-07-10 05:00:00 |      -31 |     211 | 2007-07-10 05:04:32 |      1 | 0      |     0 |       -31 | 1111000000100010 | 7000000000000000 |
paule@pc3029:~/TESTDATA$
Some results from dev-vm101
 stationid |       obstime       | original | paramid |          tbtime           | typeid | sensor | level | corrected |   controlinfo    |     useinfo      |      cfailed
-----------+---------------------+----------+---------+---------------------------+--------+--------+-------+-----------+------------------+------------------+--------------------
     90800 | 2011-03-23 12:00:00 |     29.4 |      90 | 2011-03-23 11:56:04.26427 |    330 | 0      |     0 |      29.4 | 0101000000000000 | 7000000000000000 |
     90800 | 2011-03-23 13:00:00 |     16.1 |      90 | 2011-03-23 12:56:07       |    330 | 0      |     0 |      31.4 | 0119000000000000 | 5033300000000001 | QC1-3a-90,QC2d-1-L
     90800 | 2011-03-23 14:00:00 |     33.4 |      90 | 2011-03-23 13:56:05       |    330 | 0      |     0 |      33.4 | 0114000000000000 | 5010300000000001 | QC1-3a-90,QC2d-1
(3 rows)
Note: in this first case for StationID=90800 Linear Interpolation is used because there is a missing neighbour and therefore not enough points for Akima Interpolation:
 stationid |       obstime       | original | paramid |           tbtime           | typeid | sensor | level | corrected |   controlinfo    |     useinfo      |      cfailed
-----------+---------------------+----------+---------+----------------------------+--------+--------+-------+-----------+------------------+------------------+--------------------
     90800 | 2011-03-23 08:00:00 |     22.5 |      90 | 2011-03-23 07:56:01.165423 |    330 | 0      |     0 |      22.5 | 0111000000000000 | 7000000000000000 |
     90800 | 2011-03-23 09:00:00 |     25.5 |      90 | 2011-03-23 08:56:04.61153  |    330 | 0      |     0 |      25.5 | 0111000000000000 | 7000000000000000 |
     90800 | 2011-03-23 10:00:00 |       27 |      90 | 2011-03-23 09:56:06.744562 |    330 | 0      |     0 |        27 | 0111000000000000 | 7000000000000000 |
     90800 | 2011-03-23 11:00:00 |   -32767 |      90 | 2011-03-23 17:19:33        |    330 | 0      |     0 |    -32767 | 0000003000000000 | 9999900000000000 |
     90800 | 2011-03-23 12:00:00 |     29.4 |      90 | 2011-03-23 11:56:04.26427  |    330 | 0      |     0 |      29.4 | 0101000000000000 | 7000000000000000 |
     90800 | 2011-03-23 13:00:00 |     16.1 |      90 | 2011-03-23 12:56:07        |    330 | 0      |     0 |      31.4 | 0119000000000000 | 5033300000000001 | QC1-3a-90,QC2d-1-L
     90800 | 2011-03-23 14:00:00 |     33.4 |      90 | 2011-03-23 13:56:05        |    330 | 0      |     0 |      33.4 | 0114000000000000 | 5010300000000001 | QC1-3a-90,QC2d-1
     90800 | 2011-03-23 15:00:00 |     33.3 |      90 | 2011-03-23 14:56:06.771527 |    330 | 0      |     0 |      33.3 | 0111000000000000 | 7000000000000000 |
     90800 | 2011-03-23 16:00:00 |     30.1 |      90 | 2011-03-23 15:56:02.758994 |    330 | 0      |     0 |      30.1 | 0111000000000000 | 7000000000000000 |
     90800 | 2011-03-23 17:00:00 |     26.1 |      90 | 2011-03-23 16:56:06.907794 |    330 | 0      |     0 |      26.1 | 0111000000000000 | 7000000000000000 |
     90800 | 2011-03-23 18:00:00 |     23.4 |      90 | 2011-03-23 17:57:09.594429 |    330 | 0      |     0 |      23.4 | 0111000000000000 | 7000000000000000 |
(11 rows)
Next an Akima interpolation is applied but note that the Linear value is also recorded in CFAILED for reference (NB only for testing).
 stationid |       obstime       | original | paramid |           tbtime           | typeid | sensor | level | corrected |   controlinfo    |     useinfo      |                cfailed
-----------+---------------------+----------+---------+----------------------------+--------+--------+-------+-----------+------------------+------------------+---------------------------------------
     79600 | 2011-03-23 15:00:00 |     19.3 |      90 | 2011-03-23 14:53:09.732768 |    311 | 0      |     0 |      19.3 | 0101000000000000 | 7000000000000000 |
     79600 | 2011-03-23 16:00:00 |     36.4 |      90 | 2011-03-23 15:53:15        |    311 | 0      |     0 |      15.2 | 0409000000000000 | 5033300000000002 | QC1-1-90,QC1-3a-90,QC2d-1-A,Linear=15
     79600 | 2011-03-23 17:00:00 |     10.8 |      90 | 2011-03-23 16:53:10        |    311 | 0      |     0 |      10.8 | 0404000000000000 | 5020300000000002 | QC1-3a-90,QC2d-1
(3 rows)
The following example is incorrect implementation. The Akima interpolkation gives a -ve value for Vindhastighet that is always positive!
 stationid |       obstime       | original | paramid |           tbtime           | typeid | sensor | level | corrected |   controlinfo    |     useinfo      |                   cfailed
-----------+---------------------+----------+---------+----------------------------+--------+--------+-------+-----------+------------------+------------------+----------------------------------------------
     25830 | 2011-03-23 16:00:00 |      0.6 |      81 | 2011-03-23 15:50:54.548297 |    330 | 0      |     0 |       0.6 | 0111500000000000 | 7000000000000001 | QC1-4-81,QC1-4-81
     25830 | 2011-03-23 17:00:00 |     11.8 |      81 | 2011-03-23 16:50:51        |    330 | 0      |     0 |      -1.5 | 0119100000000000 | 5033300000000001 | QC1-3a-81,QC1-3a-81,QC2d-1-A,Linear=1.1
     25830 | 2011-03-23 18:00:00 |      1.6 |      81 | 2011-03-23 17:50:50        |    330 | 0      |     0 |       1.6 | 0114100000000000 | 5010300000000001 | QC1-3a-81,QC1-4-81,QC1-3a-81,QC1-4-81,QC2d-1
(3 rows)
The case is even more interesting. Qc1 identifies a Dip at Hour=17:00 where the value is 11.8. If one ignores the points at Hours 16 and 18 then 11.8 doe snot look like a Dip.

 stationid |       obstime       | original | paramid |           tbtime           | typeid | sensor | level | corrected |   controlinfo    |     useinfo      |                 cfailed
-----------+---------------------+----------+---------+----------------------------+--------+--------+-------+-----------+------------------+------------------+-----------------------------------------
     39100 | 2011-03-24 00:00:00 |     12.4 |      90 | 2011-03-23 23:52:01.558744 |    330 | 0      |     0 |      12.4 | 0111000000000000 | 7000000000000000 |
     39100 | 2011-03-24 01:00:00 |       25 |      90 | 2011-03-24 00:52:03        |    330 | 0      |     0 |      11.4 | 0219000000000000 | 5033300000000002 | QC1-1-90,QC1-3a-90,QC2d-1-A,Linear=11.4
     39100 | 2011-03-24 02:00:00 |     10.4 |      90 | 2011-03-24 01:52:02        |    330 | 0      |     0 |      10.4 | 0214000000000000 | 5010300000000002 | QC1-3a-90,QC2d-1
(3 rows)

 stationid |       obstime       | original | paramid |          tbtime           | typeid | sensor | level | corrected |   controlinfo    |     useinfo      |                 cfailed
-----------+---------------------+----------+---------+---------------------------+--------+--------+-------+-----------+------------------+------------------+-----------------------------------------
     94500 | 2011-03-24 01:00:00 |     24.5 |      90 | 2011-03-24 00:52:38.94146 |    330 | 0      |     0 |      24.5 | 0111000000000000 | 7000000000000000 |
     94500 | 2011-03-24 02:00:00 |     41.9 |      90 | 2011-03-24 01:52:38       |    330 | 0      |     0 |      23.7 | 0419000000000000 | 5033300000000002 | QC1-1-90,QC1-3a-90,QC2d-1-A,Linear=23.5
     94500 | 2011-03-24 03:00:00 |     22.5 |      90 | 2011-03-24 02:52:38       |    330 | 0      |     0 |      22.5 | 0414000000000000 | 5020300000000002 | QC1-3a-90,QC2d-1
(3 rows)

 stationid |       obstime       | original | paramid |           tbtime           | typeid | sensor | level | corrected |   controlinfo    |     useinfo      |            cfailed
-----------+---------------------+----------+---------+----------------------------+--------+--------+-------+-----------+------------------+------------------+-------------------------------
     85040 | 2011-03-24 04:00:00 |      8.3 |      90 | 2011-03-24 03:51:40.216838 |    330 | 0      |     0 |       8.3 | 0111000000000000 | 7000000000000000 |
     85040 | 2011-03-24 05:00:00 |     24.5 |      90 | 2011-03-24 04:51:37        |    330 | 0      |     0 |       8.1 | 0119000000000000 | 5033300000000001 | QC1-3a-90,QC2d-1-A,Linear=8.8
     85040 | 2011-03-24 06:00:00 |      9.2 |      90 | 2011-03-24 05:51:40        |    330 | 0      |     0 |       9.2 | 0114000000000000 | 5010300000000001 | QC1-3a-90,QC2d-1
(3 rows)

 stationid |       obstime       | original | paramid |           tbtime           | typeid | sensor | level | corrected |   controlinfo    |     useinfo      |                cfailed
-----------+---------------------+----------+---------+----------------------------+--------+--------+-------+-----------+------------------+------------------+---------------------------------------
     85450 | 2011-03-25 02:00:00 |      5.2 |      90 | 2011-03-25 01:54:18.460609 |    311 | 0      |     0 |       5.2 | 0101000000000000 | 7000000000000000 |
     85450 | 2011-03-25 03:00:00 |     32.5 |      90 | 2011-03-25 02:54:06        |    311 | 0      |     0 |      10.9 | 0409000000000000 | 5033300000000002 | QC1-1-90,QC1-3a-90,QC2d-1-A,Linear=11
     85450 | 2011-03-25 04:00:00 |     16.8 |      90 | 2011-03-25 03:54:15        |    311 | 0      |     0 |      16.8 | 0404000000000000 | 5020300000000002 | QC1-3a-90,QC2d-1
(3 rows)

 stationid |       obstime       | original | paramid |           tbtime           | typeid | sensor | level | corrected |   controlinfo    |     useinfo      |                cfailed
-----------+---------------------+----------+---------+----------------------------+--------+--------+-------+-----------+------------------+------------------+----------------------------------------
     79600 | 2011-03-25 21:00:00 |      3.2 |      90 | 2011-03-25 20:53:22.679937 |    311 | 0      |     0 |       3.2 | 0101000000000000 | 7000000000000000 |
     79600 | 2011-03-25 22:00:00 |     28.6 |      90 | 2011-03-25 21:53:10        |    311 | 0      |     0 |       3.9 | 0409000000000000 | 5033300000000002 | QC1-1-90,QC1-3a-90,QC2d-1-A,Linear=3.9
     79600 | 2011-03-25 23:00:00 |      4.6 |      90 | 2011-03-25 22:53:21        |    311 | 0      |     0 |       4.6 | 0404000000000000 | 5020300000000002 | QC1-3a-90,QC2d-1
(3 rows)
Finally … another example where linear is adopted rather than Akima.
 stationid |       obstime       | original | paramid |           tbtime           | typeid | sensor | level | corrected |   controlinfo    |     useinfo      |      cfailed
-----------+---------------------+----------+---------+----------------------------+--------+--------+-------+-----------+------------------+------------------+--------------------
     94500 | 2011-03-25 09:00:00 |     15.8 |      90 | 2011-03-25 08:52:39.871496 |    330 | 0      |     0 |      15.8 | 0111000000000000 | 7000000000000000 |
     94500 | 2011-03-25 10:00:00 |     15.6 |      90 | 2011-03-25 09:52:37.959374 |    330 | 0      |     0 |      15.6 | 0111000000000000 | 7000000000000000 |
     94500 | 2011-03-25 11:00:00 |   -32767 |      90 | 2011-03-25 11:40:48        |    330 | 0      |     0 |    -32767 | 0000003000000000 | 9999900000000000 |
     94500 | 2011-03-25 12:00:00 |     15.6 |      90 | 2011-03-25 11:52:40.90737  |    330 | 0      |     0 |      15.6 | 0110000000000000 | 7000000000000000 |
     94500 | 2011-03-25 13:00:00 |     16.6 |      90 | 2011-03-25 12:52:42.714296 |    330 | 0      |     0 |      16.6 | 0111000000000000 | 7000000000000000 |
     94500 | 2011-03-25 14:00:00 |       36 |      90 | 2011-03-25 13:52:39        |    330 | 0      |     0 |      16.7 | 0119000000000000 | 5033300000000001 | QC1-3a-90,QC2d-1-L
     94500 | 2011-03-25 15:00:00 |     16.8 |      90 | 2011-03-25 14:52:38        |    330 | 0      |     0 |      16.8 | 0114000000000000 | 5010300000000001 | QC1-3a-90,QC2d-1
     94500 | 2011-03-25 16:00:00 |     18.5 |      90 | 2011-03-25 15:52:34.325543 |    330 | 0      |     0 |      18.5 | 0111000000000000 | 7000000000000000 |
     94500 | 2011-03-25 17:00:00 |     18.5 |      90 | 2011-03-25 16:52:40.451525 |    330 | 0      |     0 |      18.5 | 0111000000000000 | 7000000000000000 |
     94500 | 2011-03-25 18:00:00 |     18.4 |      90 | 2011-03-25 17:52:40.31381  |    330 | 0      |     0 |      18.4 | 0111000000000000 | 7000000000000000 |
     94500 | 2011-03-25 19:00:00 |     17.4 |      90 | 2011-03-25 18:52:41.345007 |    330 | 0      |     0 |      17.4 | 0111000000000000 | 7000000000000000 |