S9.2.5 - Ecosystem health in the Baltic Sea
Description
The services fulfilling the EuroDeSS are:
- daily forecasts of ecosystem health, available currently in a limited form through a non-DSS access;
- annual indicator fact sheets derived from operational monitoring and forecast model time series;
- seasonal forecasts of the ecosystem health.
Model
- The services will be based on operational ecosystem model used in Finnish Meteorological Institute, BalEcoTM, which is a coupled physical, chemical and ecological 3-dimensional ocean model. The resolution of the model in horizontal direction is 6 nautical miles, the vertical resolution is concentrated to the euphotic zone and has in total 21 layers.
Historical data
- Also historical (1979-2006) data from measurements carried out by Finnish Institute of Marine Research will be used to produce maps for comparison purposes.
Products
- Maps describing the current and forecasted state of the ecosystem health in the Baltic Sea
- Maps describing the ecosystem health in the Baltic Sea in previous decades
To be able to describe the state of the ecosystem health we will use ecological quality ratio (EQR), which will be determined by comparing different indicators (such as DIN, DIP and Chl-a) to the “reference condition” unique for each Baltic Sea basin.
Users
The resulting service will be demonstrated to
- key policymaking bodies in the Baltic Sea (e.g. HELCOM secretariat and HODs)
- regional environmental managers in Southern Finland and Estonia
- representatives of the media around the Baltic.
Demonstration
Ecosystem health in the Baltic Sea - Ecological quality ratio
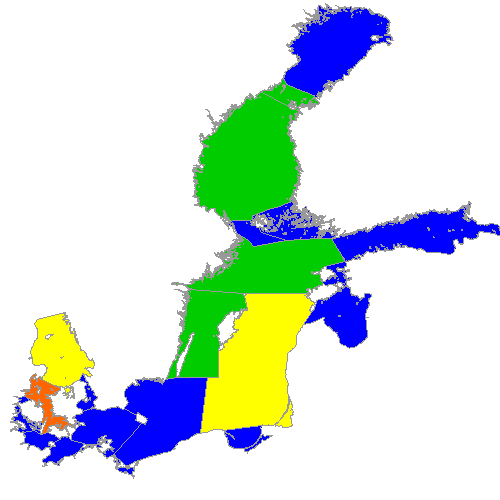
Ecological quality ratio, EQR, is a simple quantity representing the state of the ecosystem, thus (mainly) concentrating into the surface layer. It is the ratio between parameter’s actual and reference condition. It is constructed of three different variables; phosphate, nitrate and chlorophyll-a.
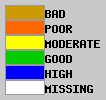
Figure 1 30 day average (17.10-17.11.2009) of EQR
As the demonstration is placed on the late autumn and since it is averaged over rather short period of time it should be taken only as an example which is still settling to its right value. It is clear from the ecosystem’s time scales that the relevant time period that should be taken account is at least two to four months long, maybe even an half of year. Since EQR has been calculated in FMI only for short time (1.5 months) and it did start after the cyanobacterial bloom it is not surprising that the EQR is higher than expected. Especially the Gulf of Finland seems to be in better condition than it should be, this can be however explained by the ecosystem and model dynamics. Phytoplankton uses most of the nutrients during spring and summer blooming and the surface nutrient concentration doesn't rise until mixing with deeper layers happens during autumn and winter (this hasn't happened yet in the model). Part of the explanation is also that the model is assimilated with observational data only in the spring.

