This is an old revision of the document!
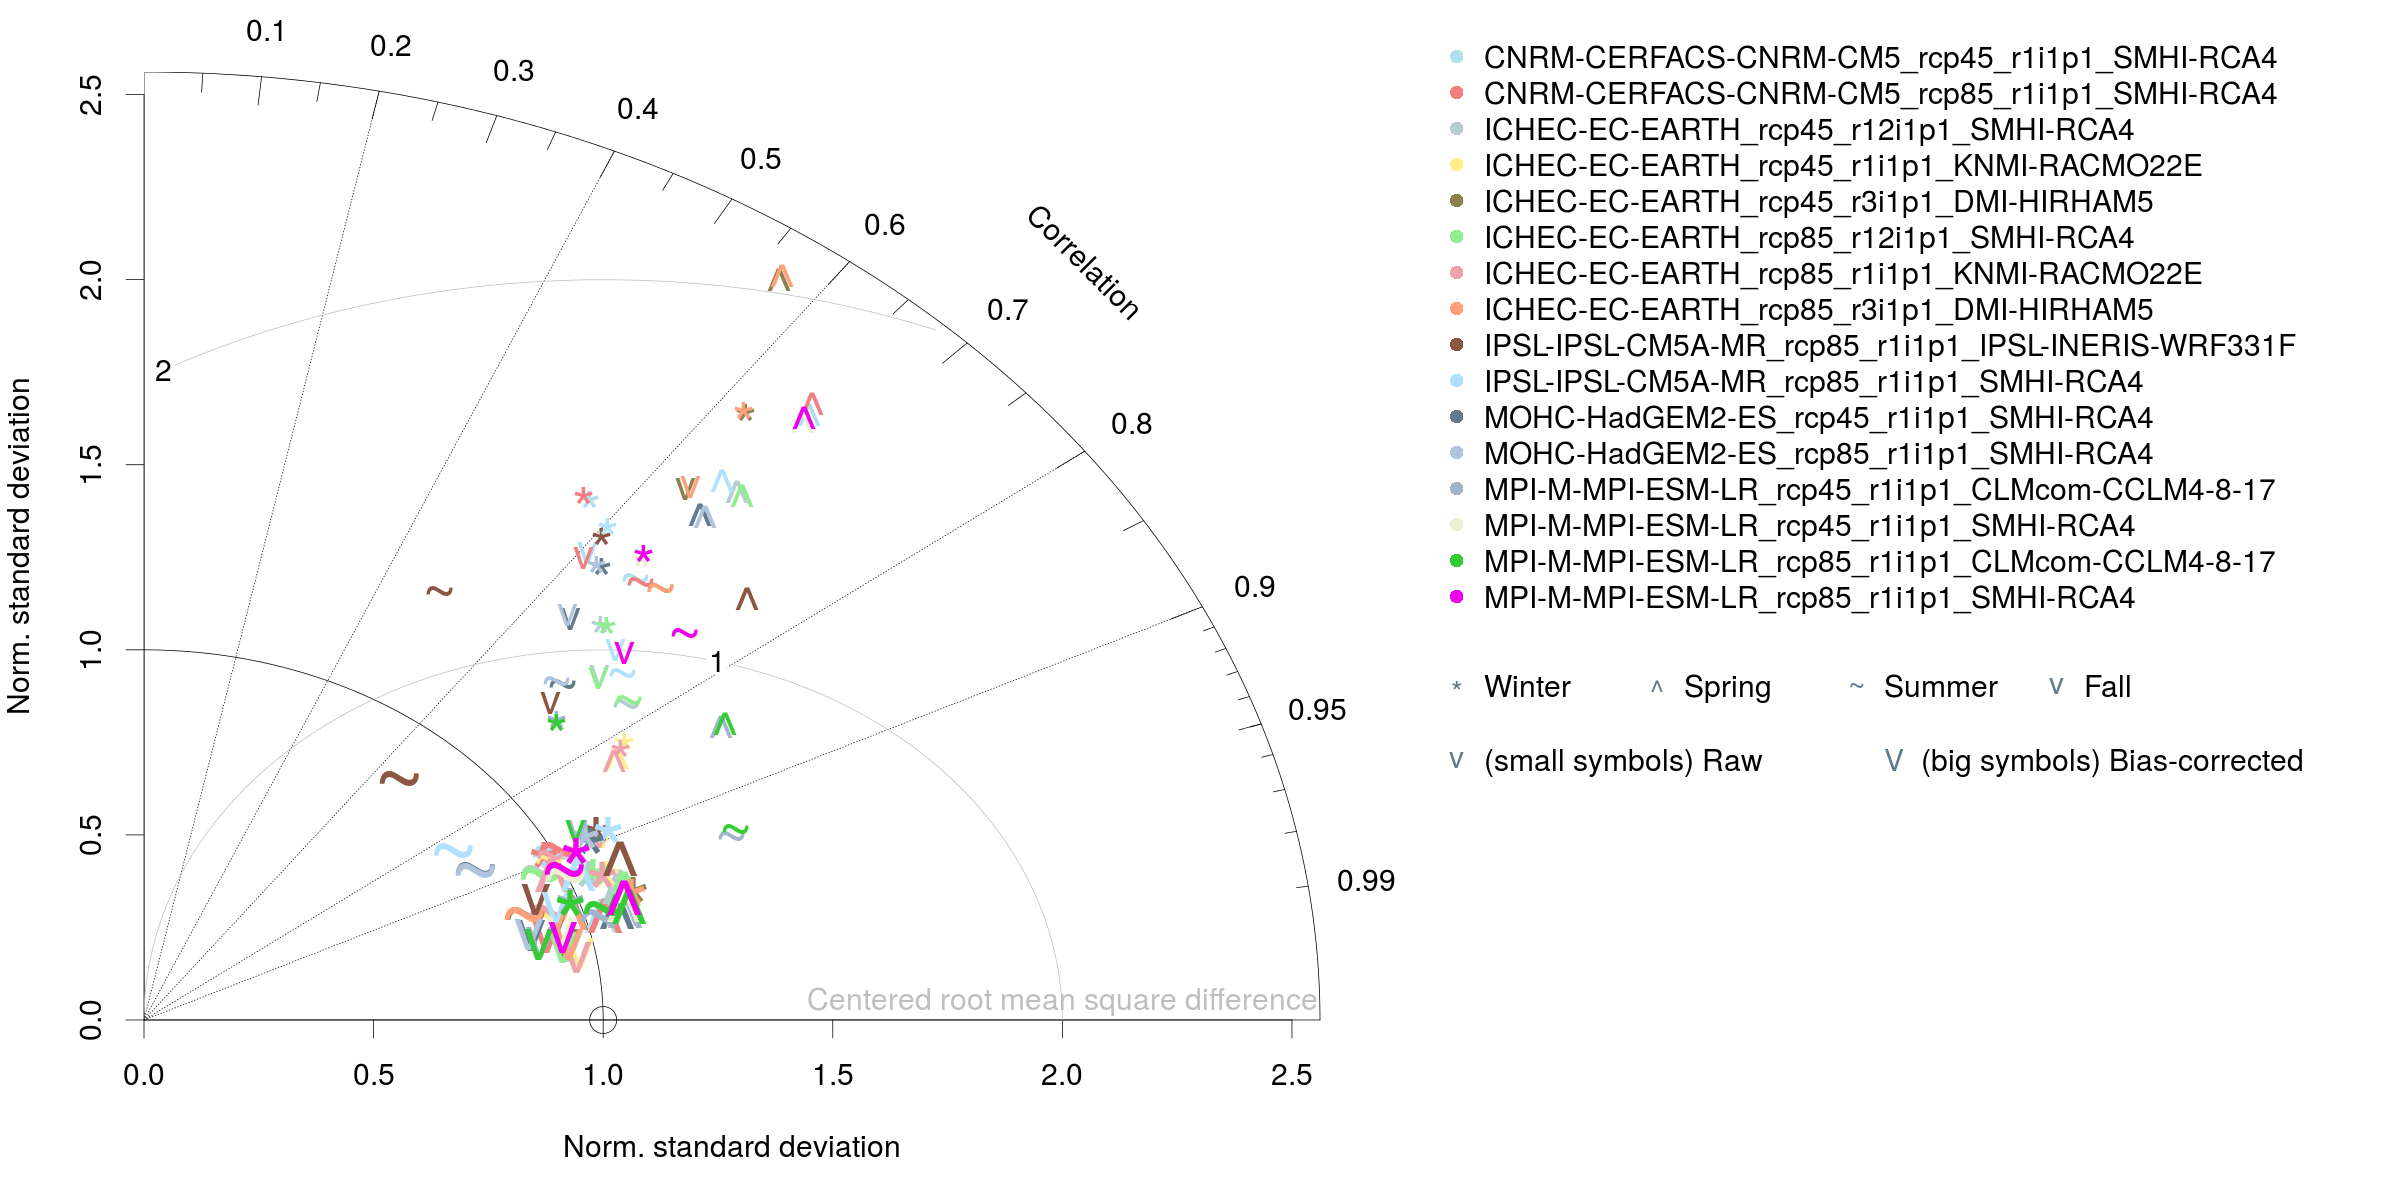
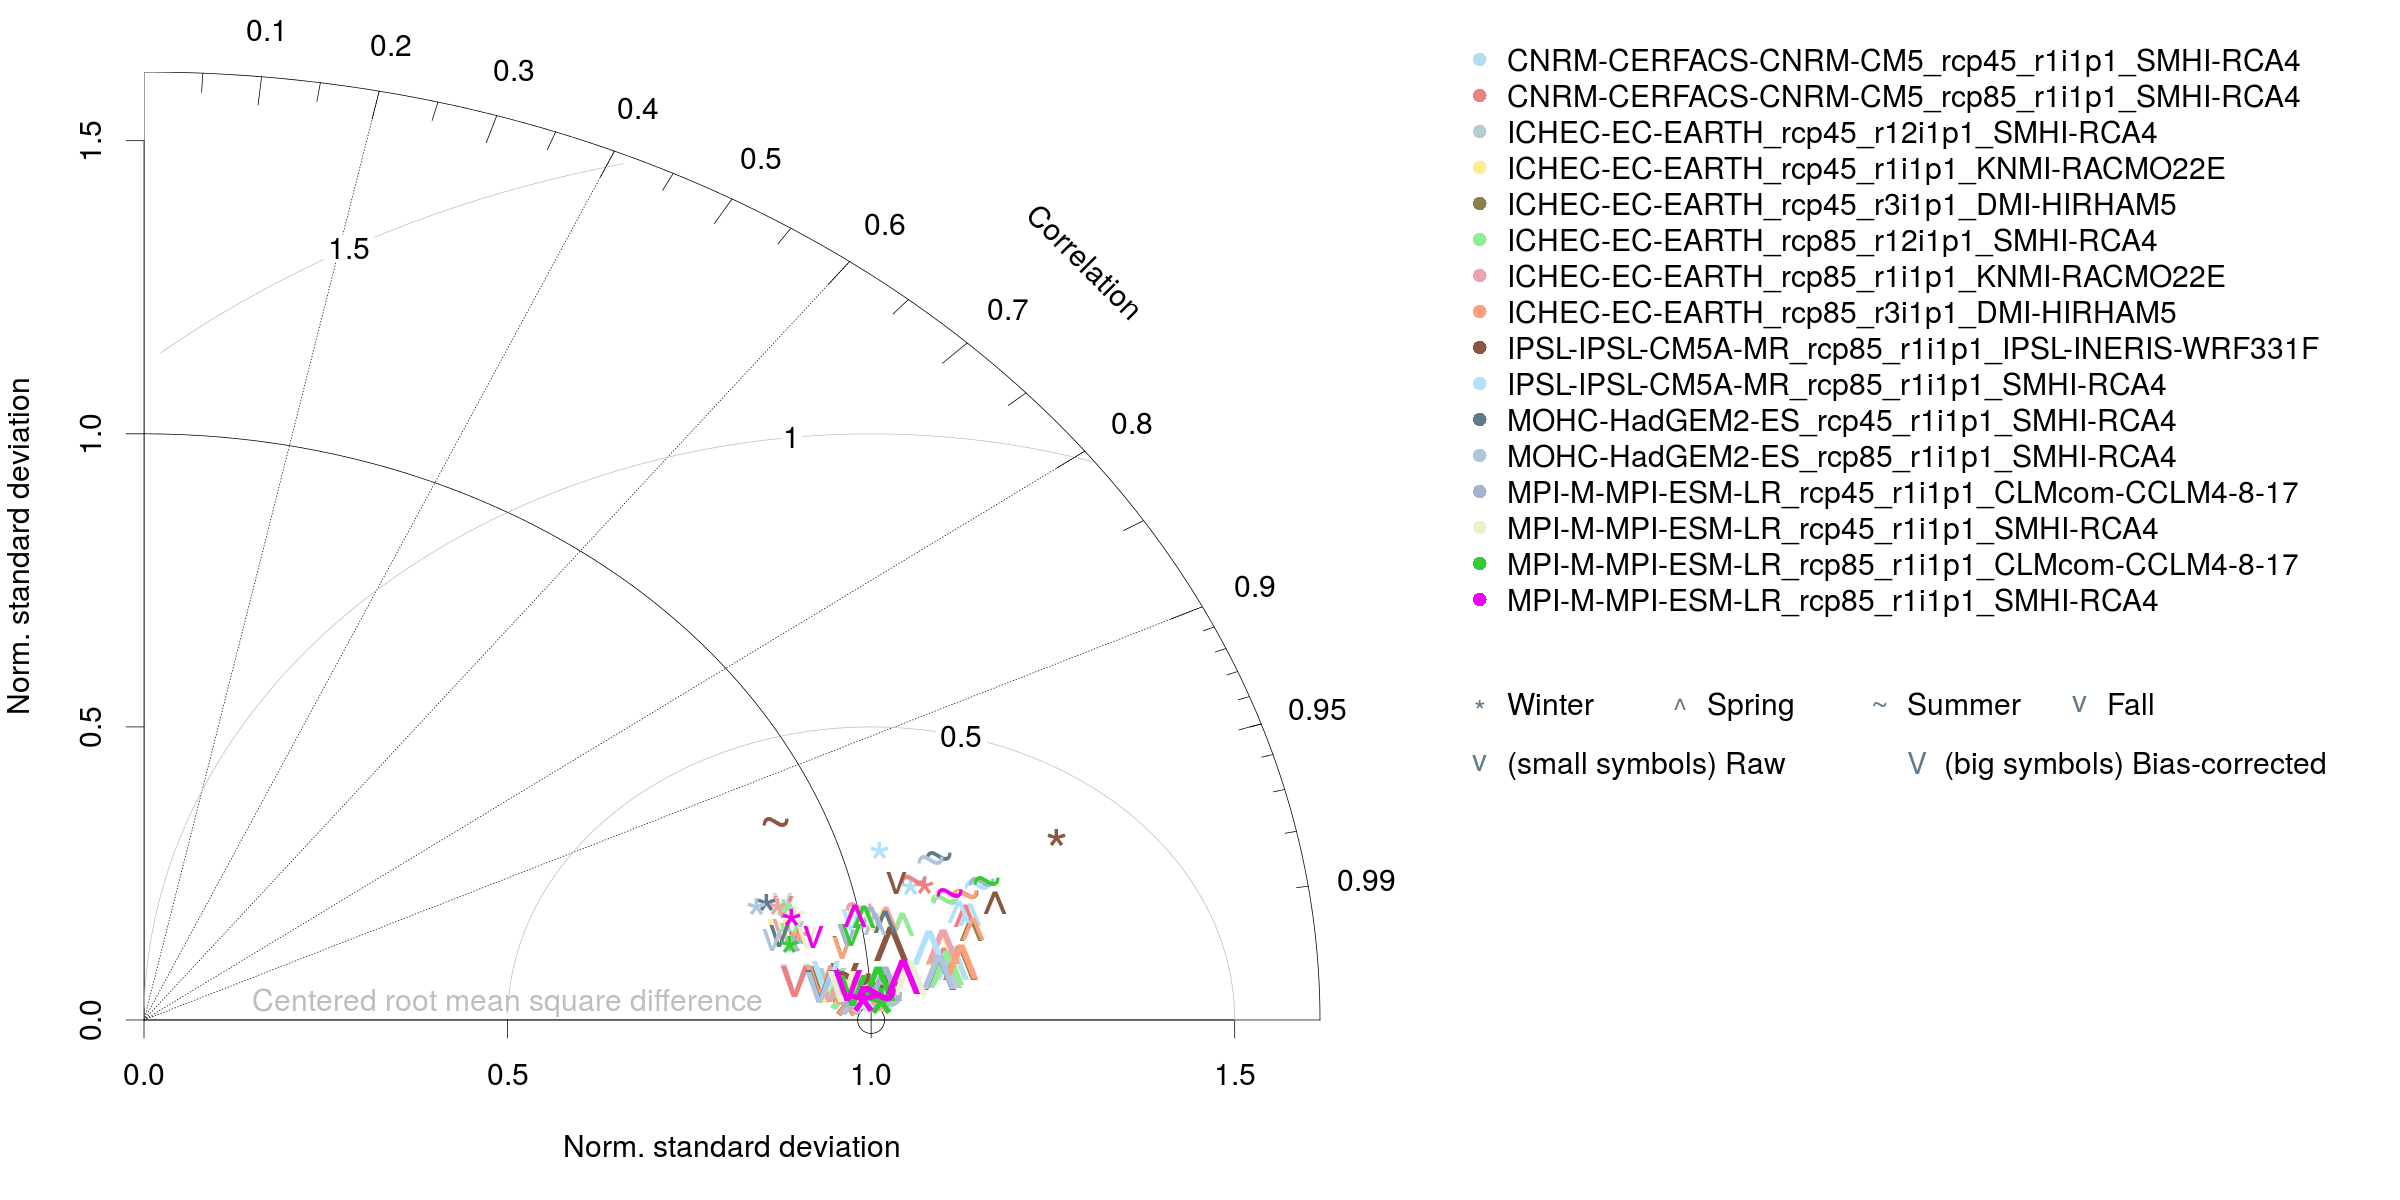
The following plots show Taylor diagrams for the bias-corrected and the raw RCM simulations at the EURO-CORDEX 0.44° grid. The daily 0.44° EOBS10 data (1981-2010) are used as reference.

clipc:evaluation
This is an old revision of the document!
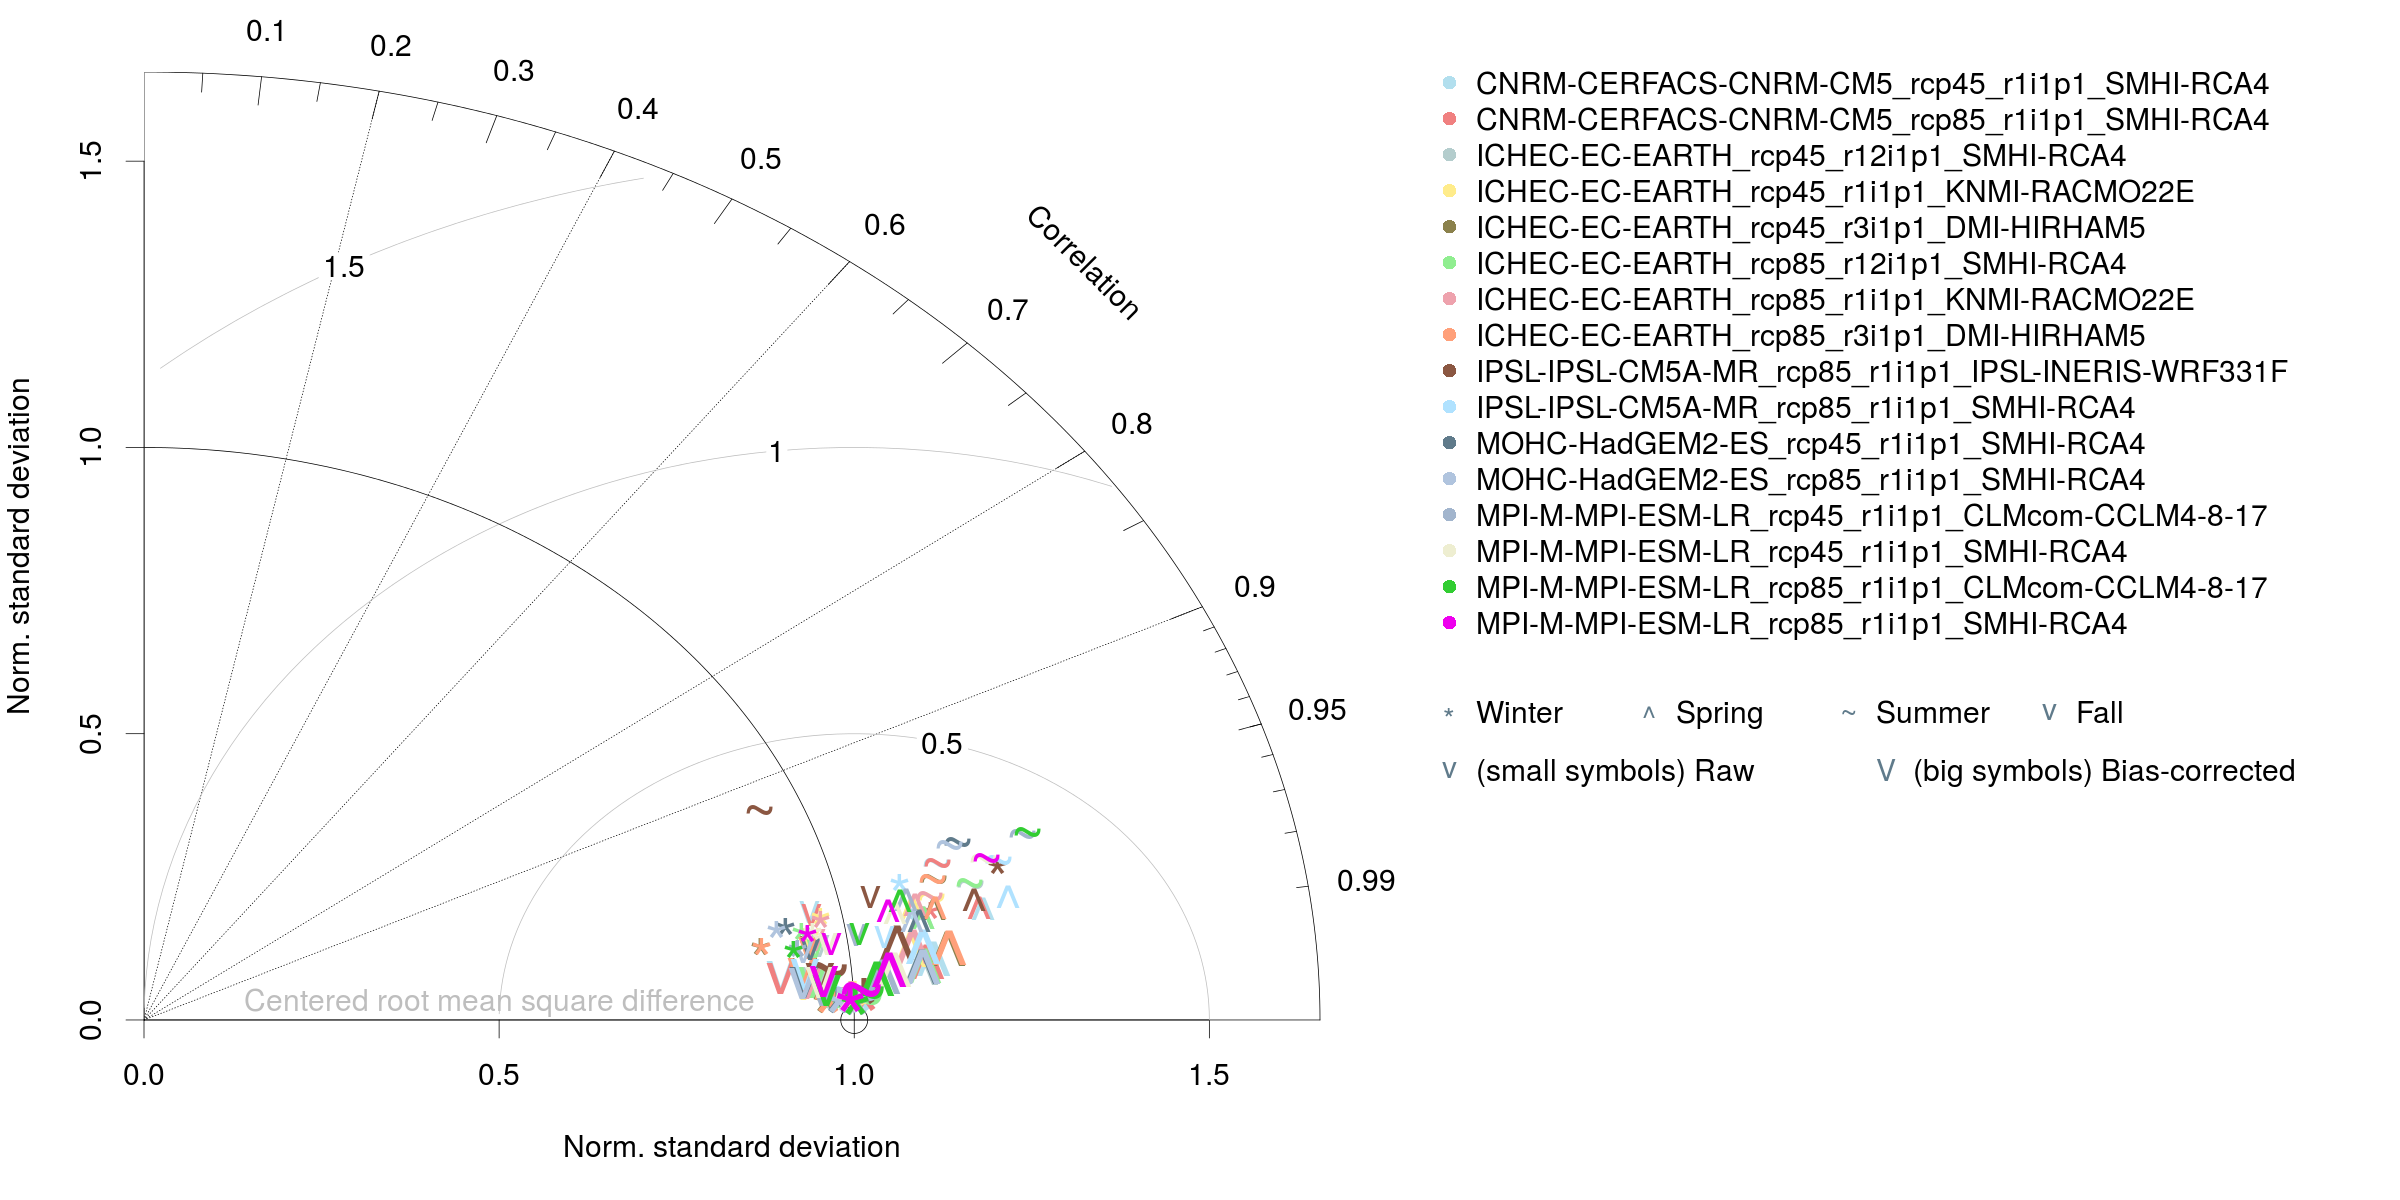
The following plots show Taylor diagrams for the bias-corrected and the raw RCM simulations at the EURO-CORDEX 0.44° grid. The daily 0.44° EOBS10 data (1981-2010) are used as reference.