This is an old revision of the document!
EURODELTA-CARB, EMEP/CAMS model experiment
Participants:
Coordination
- Augustin Colette (INERIS, EMEP/TFMM Chair, CAMS_50 Scientific Advisor)
Modellers:
- EMEP/MSC-W: Hilde Fagerli, David Simpson, Svetlana Tsyro (Met Norway MSC-W, NO)
- EMEP/MSC-E: Alexey Gusev (MSC-East, RU)
- CHIMERE: Augustin Colette, Frédérik Meleux (INERIS, FR), Marta Garcia Vivanco (CIEMAT, ES)
- DEHM: Camilla Geels, Lise Frohn (Aarhus, DK)
- GEM-AQ: Joanna Strużewska (IEP, PL)
- Lotos-Euros: Renske Timmermans (TNO, NL), John Ntouros (KNMI, NL)
- MATCH: Camilla Andersson, Ana Carvalho (SMHI, SE)
- MINNI: Mihaela Mircea (ENEA, IT)
- MOCAGE: Joaquim Arteta (Meteo-France, FR)
- MONARCH: Oriol Jorbal (BCS, ES)
- WRF-CHEM: Aura Lupascu (IASS, DE)
Observations
- Maria Cruz Minguillon (CSIC, ES)
- Wenche Aas, Stephen Platt, (NILU/CCC, NO)
Emissions
- Jeroen Kuenen (TNO, NL)
Background
Main motivation: improve the modelling of Black Carbon (Tagged Elemental Carbon), SOA (Condensables), and BaP
Take stock of (i) Developments in emission inventories (LRTAP BC, condensables) and (ii) Winter 2017/2018 field campaign (EMEP/ACTRIS/COLOSSAL)
Modelling experiment
Assess the impact of a more consistent emission inventory for wood burning
A: CAMS-REG-AP_v2.2.1_2015_REF1: EMEP National Totals + TNO Spatialisation
B: CAMS-REG-AP_v2.2.1_2015_REF2: Same as A but including Condensable for Small Combustion in primary PM (independently from EMEP national totals)
Compare with the EMEP reference inventory (main difference compared to A regards spatialisation proxies)
C: EMEP 0.1 official country inventories
Test the LRTAP Black Carbon inventory (only available for 2017)
D: Same as C + BC modelling
Test the LRTAP BaP inventory
E: Same as C + BaP
Note: C/D/E can be part of the same model run
Technical Specifications
all input/output data are on ftpmoca.ineris.fr, contact augustin.colette@ineris.fr for login details
Model Setup
CAMS_50 Specifications
- Geographical domain: 0.1 deg resolution, 25°W-45°E, 30°N-72°N
- Time period: 20171201-20180228
- Meteorology: IFS ftpmoca.ineris.fr:/Eurodelta-Carb/Meteo/*tgz
- Boundary Conditions: C-IFS ftpmoca.ineris.fr:/Eurodelta-Carb/Boundaries/*nc
- Emissions: ftpmoca.ineris.fr:/Eurodelta-Carb/Emissions/
- A: CAMS-REG-AP_v2.2.1_2015_REF1.csv
- B: CAMS-REG-AP_v2.2.1_2015_REF2.csv
- C-E: pending
- PM Splits (EC, OC, SO4, Na, OthMin in PM10 and PM2.5, note the different versions for REF1&REF2)
PM_split_for_CAMS-REG-AP_v2_2_1_rev_20190326_REF1_2015.xlsx PM_split_for_CAMS-REG-AP_v2_2_1_rev_20190326_REF2_2015.xlsx
- Wood Burning / Fossil Fuel Share in PM10 and PM2.5 emissions (note the different versions for REF1&REF2)
Share_biofuels_in_PM_small_combustion_REF1_2015.csv Share_biofuels_in_PM_small_combustion_REF2_2015.csv
- EC_wb is defined as the wood burning share of EC emissions in the PM2.5 fraction. It is computed from the national/sector PM2.5 emissions, modulated by the GNFR_Sector/C share of EC_fine and the share of biofuel for a given country
- EC_ff is defined as the fossil fuel share of EC emissions in the PM2.5 fraction. It includes all the remaining EC_fine
- Splits only available for coarse/fine (above/below 2.5µm), models apply their own splits below 1µm
- Temporal variations: not prescribed (degree days or monthly climatologies)
Model Outputs
Surface only CAMS grib (for CAMS models) or netcdf: 1 file per species (whole period) Species: * PM10, PM2.5, PM1, NO2, O3, * PM Species (in PM10, PM2.5, PM1 fractions) EC_ff, EC_wb, POA, OPPM (any other primary PM), SOA, NO3p, NH4p, SO4p
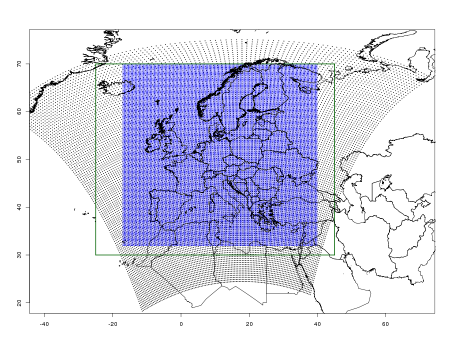
The modelling domain is displayed in the Figure below. The model used for the analysis of the Campaigns (green lines below)does not fit in the Euro-Cordex domain (grey dots, see section on meteorology), therefore a new domain (blue dots) at a resolution of about 25km is proposed. This domain follows a regular lat/lon projection with increments of dlat=0.25 and dlon=0.4, which is about 25km.
The coordinates of the centre of grid cells are https://esgf.extra.cea.fr/thredds/fileServer/store/colettea/EURODELTA/COORD_EDT.

Meteorology
The ECMWF/IFS model was used for recent Campaign analyses since its horizontal resolution is about 25km for recent years. For longer time periods, the horizontal resolution of the ERA-Interim (about 80km) and ERA-Clim (125km) are considered too coarse. Therefore, we propose to use a dynamical downscaling of the ERA-Interim global reanalysis with the Weather Research and Forecast Model at 0.44 degrees of resolution.
Building upon the expertise developed in the EuroCordex climate downscaling programme (Jacob et al., 2013) a regional climate model evaluation with perfect boundary conditions (reanalyses, instead of free climate runs) was proposed by (Kotlarski et al., 2014). The corresponding member of the EuroCordex ensemble has been optimized by IPSL (R. Vautard) since then as described in (Stegehuis et al., 2014) and we propose to use in Eurodelta a strongly nudged realization of this last model setup. The exact setup of this model run is given in Table S1 of (Stegehuis et al., 2014)(row#7). Unlike the simulations discussed in this paper, the model run provided for EuroDelta includes grid nudging (except in the PBL) in order to improve temporal correlations compared to the regular free-running Cordex simulations. Note that no nudging towards observation is performed (except that of ERA-Interim).
Changing meteorological driver might have an impact on natural emissions as well as other processes. Modelling groups are welcome to share the outcome of any sensitivity simulation performed to assess the impact of using WRF simulations.
Whereas this model setup has been thoroughly validated in the past, a specific meteorological evaluation for the need of air quality modelling will be performed as part of this Eurodelta3-II exercise.
The volume of data for the meteorological forcing is at least 50G/yr (estimate for the list of variables required for Chimere ). The data is available at:
https://esgf.extra.cea.fr/thredds/catalog/store/colettea/EURODELTA/METEO/catalog.html.
Biogenic and natural Emissions
There is no constrain for biogenic emissions (NO & VOCs) and for natural and road resuspension of dust emissions, although the corresponding emission used in each model and tracking of corresponding concentrations (where relevant) will be reported.
Forest fires should be ignored.
Anthropogenic Emissions
Following up on the Eurodelta3 phase I methodology, emissions are provided by INERIS on the common model grid as annual fluxes.
Annual totals
GAINS emissions, provided as country totals under SNAP sectors, will be used for the years 1990, 1995, 2000, 2005, 2010. Intermediate years will be linearly interpolated by country and by sectors. The version of these emissions is ECLIPSE-V5.
Emission Spatialisation & Disaggregation
The temporal (monthly and hourly) profiles will be those of TNO as provided for the AQMEII3 exercise.
A NO2/NOx ratio of 20% will be used. Given the resolution of the model (about 25km), this ratio is not expected to bear upon the results substantially.
The emissions are provided on the ED-Trend domain using the spatial regridding methodology of INERIS. It consists in:
- Europe-wide road and shipping proxies for SNAP7 and 8 (constant for 20yrs)
- Population density proxy for residential emissions (trained on French bottom-up 1km inventory) (constant for 20yrs)
- EPRTR for industrial sources location and magnitude (time varying over the past 20yrs), although the quality of this data is not guaranteed, localised differences should have a limited impact at 25km resolution, and the broad patterns should be respected.
- Use of bottom-up emission inventories as spatialisation proxies for France & United Kingdom.
- TNO-MACC inventory for NH3 emissions
In the proposed spatialisation method, only the location and fluxes of large point sources change in time over the past decades. While emissions at a 50km resolution are available for selected countries, pollutants, and sectors, it is considered that the spatialisation of these emissions is not necessarily better than the more recent techniques involving consistent and high-resolution proxies over Europe. This should in particular be the case for road and residential sectors. For the industrial sector, there is however the potential to improve the quality of inventories in the 1990s. This potential added value will be investigated when preparing inventories for 1990 and 2000 (by 20150228).
The INERIS-EDT 2010 emission data and TNO profiles are available at: https://esgf.extra.cea.fr/thredds/catalog/store/colettea/EURODELTA/EMISSIONS/catalog.html
TNO will make a sensitivity simulation to compare the result with the above spatialisation strategy with the TNO-MACC3 emissions for 2010. Other modelling groups are welcome to share the outcome of any corresponding sensitivity simulations.
Boundary Conditions
There are two options for boundary conditions (i) climatology of observational data, (ii) global model results. Both have pros and cons. Global model carry biases, and observations are fitted at measurement points (in the present case the temporal trend of Mace Head is applied throughout the domain). It has been decided to use the first option for most simulations, and keep the second option for sensitivity experiments.
Both sources are provided as monthly means, participating groups are free to make a temporal interpolation, or to switch from one month to another in the boundary condition each 1st day of the month in the regional simulation (which will be the case at least for CHIMERE, EMEP and MINNI).
Climatology of observational data
For ozone, a 3D climatology based on observational vertical profiles is consolidated and updated by J. Logan et al. Proposal is to use this 3D climatology in conjunction with a temporal (monthly) variation over the past 20 years. Long lived species (CH4) are held fixed in the simulation. A few other species such as sulphate, ammonium, nitrate and sea salt are also provided. Dust derived from a global model are also given. Particulate species are split between the fine (0-2.5µm) and coarse fraction (2.5-10.0µm) with the following median diameter: 0.33e-6 m for all fine, 3.0e-6 m for coarse nitrate, 4.8e-6 m for coarse sea salt, 5.0e-6 m for coarse dust. The molar mass to be used for the conversion of dust to µg/m3 is 200g/mole.
The data is available as Obs_EMEP_1990-2010.tar under : https://esgf.extra.cea.fr/thredds/catalog/store/colettea/EURODELTA/BOUN_COND/catalog.html
The brief documentation is provided here readme_bcs_emep.pdf
Global model results
The Climate-Chemistry Model Initiative is currently undertaking global atmospheric chemistry reanalyses over the 1960-2010 time period (Eyring, 2014) based on the MACC City emissions (Granier et al., 2011). We propose to use the CamChem member of the ensemble (Lamarque et al., 2012) produced by Simone Tilmes at NCAR provided by Katerina Sindelarova (katerina.sindelarova@latmos.ipsl.fr) and Claire Granier (cgranier@latmos.ipsl.fr) at LATMOS/IPSL. The data is available as CAM4CHEM_CCMI.tar: https://esgf.extra.cea.fr/thredds/catalog/store/colettea/EURODELTA/BOUN_COND/catalog.html
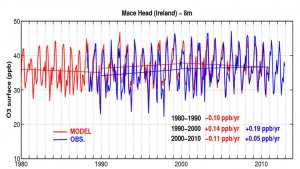
Validation of this global reanalysis is ongoing, but the preliminary results are encouraging as illustrated in the Figure below showing the ozone trend at the Mace Head station.
 Monthly variation of ozone at the Mace Head station (Observation courtesy of Peter Simmonds and Gerry Spain, and Model results courtesy of Thierno Doumbia, Katerina Sindelarova, Claire Granier)
The Eurodelta participants accept not to use these results for publication in the peer reviewed litterature before the end of 2015 without asking the explicit authorisation to Claire Granier (NOAA/CNRS, cgranier@latmos.ipsl.fr). After that date, co-authorship will be offered to the owner of the data upon submitting a manuscript. In any publication, the following acknowledgement should be included: “the data were produced as part of the CCMI and PEGASOS projects.”
Output Format
A common format for the results of modelling teams is specified in the following document output formats
Participating groups can provide either model output at the first model level, or downscalled vertically as long as the downscaling procedure is clearly documented.
For the case of VOC output, the aggregation strategy of each modelling group is summarised in the following document voc_aggregation.zip
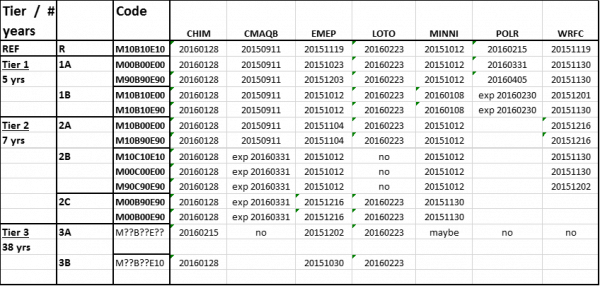
The simulation status for each modelling group is summarised in the table below. “exp” stands for expected delivery date, the last update for each experiment is specified, although some deliveries occured earlier.

Bibliography
- Banzhaf, S., M. Schaap, R. Kranenburg, A.M.M. Manders, A.J. Segers, A.H.J. Visschedijk, H.A.C. Denier van der Gon, J.J.P. Kuenen, E. van Meijgaard, L.H. van Ulft, J. Cofala and P.J.H. Builtjes, Dynamic model evaluation for secondary inorganic aerosol and its precursors over Europe between 1990 and 2009, Geosci. Model Dev. Discuss. 7(2015), pp. 4645-4703.
- Eyring, V., Report on the IGAC/SPARC Chemistry-Climate Model Initiative (CCMI) 2013 Science Workshop. SPARC Newsletter (2014).
- Kotlarski, S., K. Keuler, O.B. Christensen, A. Colette, M. Déqué, A. Gobiet, K. Goergen, D. Jacob, D. Lüthi, E. van Meijgaard, G. Nikulin, C. Schär, C. Teichmann, R. Vautard, K. Warrach-Sagi and V. Wulfmeyer, Regional climate modeling on European scales: a joint standard evaluation of the EURO-CORDEX RCM ensemble, Geosci. Model Dev. 7(2014), pp. 1297-1333.
- Stegehuis, A.I., R. Vautard, P. Ciais, A.J. Teuling, D.G. Miralles and M. Wild, An observation-constrained multi-physics RCM ensemble for simulating European mega-heatwaves, Geosci. Model Dev. Discuss. 7(2014), pp. 7861-7886.
- Jacob, D., J. Petersen, B. Eggert, A. Alias, O. Christensen, L. Bouwer, A. Braun, A. Colette, M. Déqué, G. Georgievski, E. Georgopoulou, A. Gobiet, L. Menut, G. Nikulin, A. Haensler, N. Hempelmann, C. Jones, K. Keuler, S. Kovats, N. Kraner, S. Kotlarski, A. Kriegsmann, E. Martin, E. Meijgaard, C. Moseley, S. Pfeifer, S. Preuschmann, C. Radermacher, K. Radtke, D. Rechid, M. Rounsevell, P. Samuelsson, S. Somot, J.-F. Soussana, C. Teichmann, R. Valentini, R. Vautard, B. Weber and P. Yiou, EURO-CORDEX: new high-resolution climate change projections for European impact research, Regional Environmental Change(2013), pp. 1-16.
- Lamarque, J.F., L.K. Emmons, P.G. Hess, D.E. Kinnison, S. Tilmes, F. Vitt, C.L. Heald, E.A. Holland, P.H. Lauritzen, J. Neu, J.J. Orlando, P.J. Rasch and G.K. Tyndall, CAM-chem: description and evaluation of interactive atmospheric chemistry in the Community Earth System Model, Geosci. Model Dev. 5(2012), pp. 369-411.
- Granier, C., B. Bessagnet, T. Bond, A. D'Angiola, H. Denier van der Gon, G. Frost, A. Heil, J. Kaiser, S. Kinne, Z. Klimont, S. Kloster, J.-F.o. Lamarque, C. Liousse, T. Masui, F. Meleux, A. Mieville, T. Ohara, J.-C. Raut, K. Riahi, M. Schultz, S. Smith, A. Thompson, J. van Aardenne, G. van der Werf and D. van Vuuren, Evolution of anthropogenic and biomass burning emissions of air pollutants at global and regional scales during the 1980-2010 period, Climatic Change 109(2011), pp. 163-190.
- van Vuuren, D., J. Edmonds, M. Kainuma, K. Riahi, A. Thomson, K. Hibbard, G. Hurtt, T. Kram, V. Krey, J.-F. Lamarque, T. Masui, M. Meinshausen, N. Nakicenovic, S. Smith and S. Rose, The representative concentration pathways: an overview, Climatic Change 109(2011), pp. 5-31.